
Agritourism—defined in this study as any activity or service provided on a working farm with the purpose of attracting visitors—has grown in popularity due to structural changes affecting farmers and communities across the nation and throughout North Carolina. According to the North Carolina Rural Center, the number of farms in North Carolina has dramatically declined in recent years to just 17% of the total number of farms present in the 1940s. The changing economy, fluctuations in agricultural income, and farmers’ desire to preserve land and resources have pressured North Carolina farmers to examine alternative economic opportunities.
Agritourism has the potential to enable farmers to keep their operations afloat. However, for farms to fully benefit from agritourism as an economic resource, research is needed to understand the agritourism market and give agritourism businesses the tools to effectively market themselves to prospective and returning visitors. Understanding who agritourism visitors are, the types of experiences they seek, and how they plan agritourism travel will help farmers make wise business decisions about where to invest money in marketing and how to maximize profits.
To better understand visitors to North Carolina agritourism farms, the authors conducted a pilot study in 2010. The study analysis includes visitors’ self-reports of information about their most recent farm visit experiences and how they made their plans to travel to agritourism farms, as well as farm owners’ self-reported perspectives on their agritourism businesses. Six farms across North Carolina with differing product offerings participated in the study. The farms are referred to by letters of the alphabet (Farm A through Farm F) for privacy purposes.
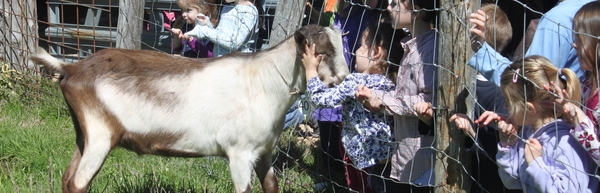
Photo courtesy of Celebrity Dairy, Siler City, NC
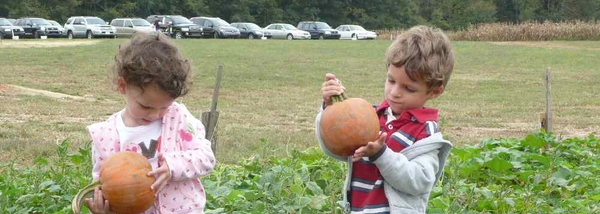
Photo courtesy of Aw Shucks Farms, Monroe, NC
Research Methods
The research team conducted an online postvisit survey of visitors to the participating farms. This survey method was chosen to lessen the chance of data-collection procedures inconveniencing visitors or detracting from their experiences while at the farms. Participating farmers and the research team collected e-mail addresses and zip codes from visitors prior to their departure from the farms. Postvisit surveys were emailed to participants within a week of their visit, and survey reminders were emailed the following week.
A total of 468 e-mail addresses were collected from the farms. After the initial mailing, 77 of the addresses were discarded due to bounce-backs, resulting in 391 usable e-mail addresses. Upon completion of data collection, a total usable data sample of 141 completed online surveys was collected, resulting in a 36 percent response rate.
Research Notes
Because of the study’s small sample size, it is not representative of all agritourism farms or visitors in North Carolina and provides only a snapshot from the perspective of the six agritourism farm operators and the 141 visitor respondents. This publication is only a summary of the study’s key findings. To view the complete version of the overall study report, visit http:// www.ncsu.edu/tourismextension/ programs/documents/Agritourism_ NorthCarolina_overall_report.pdf.
Respondent Demographics
- 85% white
- 71% female
- 48% between the ages of 21 and 40
- Annual household income:
- 24% made $40,001–$60,000
- 24% made more than $100,000
- 78% lived in North Carolina
- Money spent during farm visit:
- 29% spent $26–$50
- 30% spent less than $25
Travel Party Characteristics
Results suggest that visitors valued visiting farms as a family activity (Figure 1). Accordingly, a plurality of respondents (46%) indicated that they traveled to the farm as one family (parents with children), followed by travel parties consisting of several parents with children (17%) and grandparent(s) with grandson(s)/ granddaughter(s) (13%). A majority of the e-mail addresses were collected on the weekend; thus, visits as part of an organized group (e.g., school group) are likely underreported.
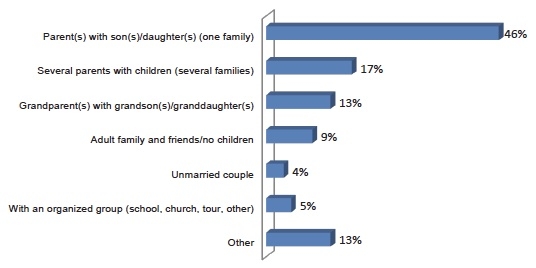
Figure 1. Which of the following best describes the group with whom you visited the farm? (n = 150)
Farm Visit Experiences
As illustrated by Figure 2, respondents were almost equally divided between first-time visitors to the farms (49%) and repeat visitors (51%). A large majority of respondents (91%) indicated that they would visit the farm again in the future, which suggests opportunities for farms to build loyal repeat customers.
When asked how enjoyable their most recent visit to the farm was, almost all respondents (97%) rated their visit as enjoyable to extremely enjoyable (Figure 3). None of the respondents considered their visit to be not enjoyable at all.
Respondents were asked to use a five-point scale (5 = very good, 1 = very poor) to rate the quality of their farm visit experience in terms of twenty specific attributes. As illustrated in Figure 4, “farm scenery” and “product freshness” scored the highest (4.4), and “admission cost” and “activity cost” scored the lowest (3.3).
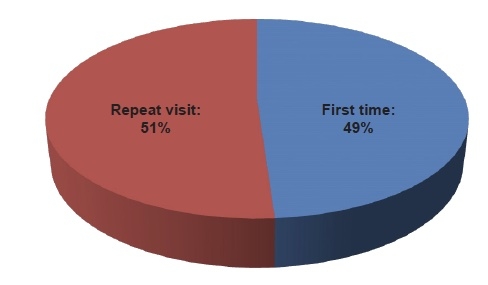
Figure 2. Was this your first visit to this farm? (n = 141)
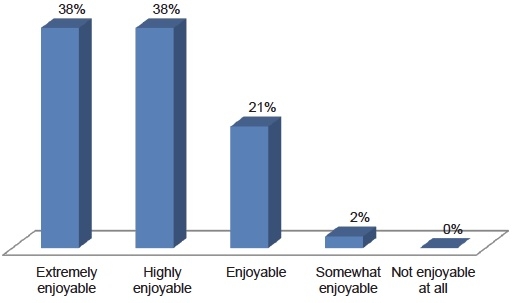
Figure 3. Overall, how would you rate your most recent visit to this farm? (n = 138)
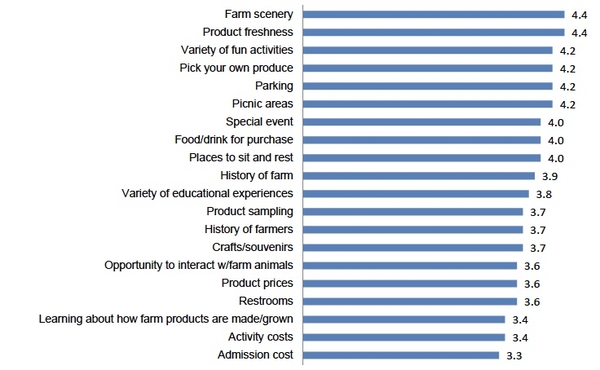
Figure 4. Rate your experience with each of the following during your last visit to the farm.
Reasons for Visiting the Farm
When making business and marketing decisions, it is important to consider visitors’ motivations. Farm visitors were asked to rank the importance of various reasons for visiting the farm (Figure 5). Visitors ranked “spending time outside” (4.6) and “family activity” (4.5) as the most important reasons for visiting the farm.
Similarly, farmers were asked their opinion regarding which reasons were most important in influencing people to visit their farm. Farmers ranked “family activity” (4.8) and experiencing “personal sales/interaction” (4.8) as visitors’ most important reasons for visiting their farm. When asked to indicate the most important reason for visiting the farm, 49 percent of visitor respondents chose “family activity.”When asked the same question, 50 percent of farmers chose “farm experience.”
When asked what they liked most about their visit other than the weather, the top three responses from visitor respondents were:
- Knowledgeable, friendly staff/ people
- Activities for children/kid friendly
- Good products/homemade items
The majority of visitor respondents noted that they would like to see more animals/hands-on experiences with animals added to the farms in the future.
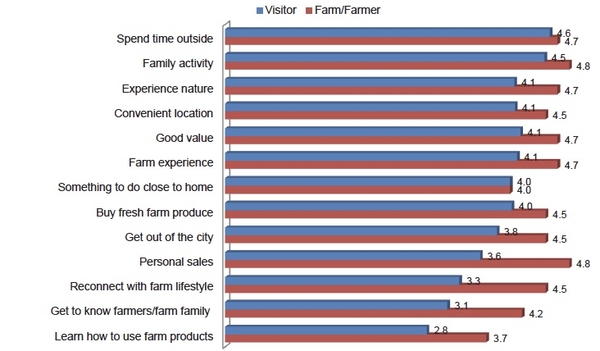
Figure 5. How important was each of the following reasons for making this visit?
Travel Patterns and Marketing Implications
A plurality of visitor respondents (44%) indicated that they visited only the farm on their current trip before returning home, meaning that they did not visit any other attractions or engage in any other recreational activities while traveling to and from the agritourism destination (Figure 6). However, 21 percent of visitor respondents indicated that while the farm was their primary reason for traveling that day, they also visited several other places. Additionally, 14 percent noted that the area in which the farm was located was their primary reason for traveling.
For those respondents who did something else during their travels that day, the plurality indicated that they had eaten at a restaurant (36%), followed by going shopping (17%), visiting family or friends (12%), visiting other attractions in the surrounding area (11%), and swimming or hiking (6%).
These travel patterns suggest that agritourism farms are creating opportunities for increased economic activity in their regions.
A large majority of respondents (81%) indicated that their experience in the area was enhanced by their visit to the farm. This response highlights the positive impacts of agritourism on the the local community and the overall tourism experience.
These findings suggest that operators of agritourism farms have ample opportunities to develop collaborative marketing strategies in cooperation with surrounding businesses. Given that visitors are seeking other businesses and experiences in addition to the farms, farmers should use these travel patterns and business connections to their advantage by continuing to identify ways to collaborate with area businesses to increase awareness and visitation. Farmers should also seek out opportunities to highlight their positive role in leading to increased visitation and spending in their community.
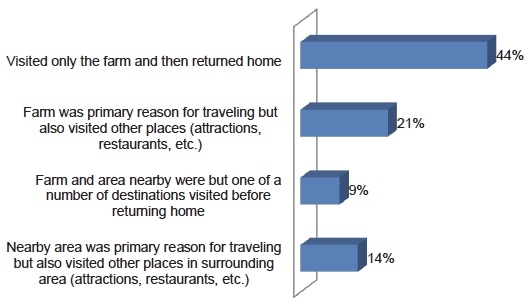
Figure 6. Which of the following best describes your recent farm visit? (n = 123)
Trip Planning and Marketing
A plurality of respondents (34%) planned their trip less than one week in advance (Figure 7).
When visitors were asked how they learned of the farm, the top responses were:
- Word of mouth—heard about it from someone else (43%)
- Saw it when I drove by (23%)
- Farm website (20%)
- Google or other Internet search engine (14%)
- Road signage (14%)
These findings suggest that farm owners need to ensure positive onfarm experiences to help increase positive word of mouth, develop and use good signage to increase awareness and visitation from visitors driving by, and increase and maintain a robust online presence.
As illustrated in Figure 8, a majority of visitors (57%) visited the farm’s website at some point, whether before their visit (40%), after their visit (9%), or both before and after their visit (8%). These findings demonstrate that visitors are using farm websites as a tool for gathering information about the farm. Farms should take this behavior into account when determining what information to include on their website. Farmers should also make sure that all website information is current (e.g., contact information, hours, directions, etc.).
When asked about social media usage, the majority of respondents (67%) said they used social media sites such as Facebook and Twitter. Most respondents (57%) indicated that if the farm they visited had a page on a social media site, they would use that page to follow events and specials or to view photos and videos. These results suggest that farmers can use social media to promote farm visits and awareness and to increase engagement between farms and visitors.
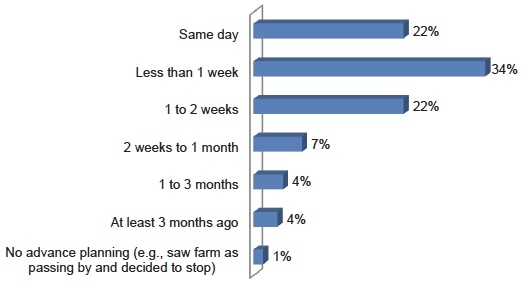
Figure 7. How far in advance did you plan your visit to this farm? (n = 133)
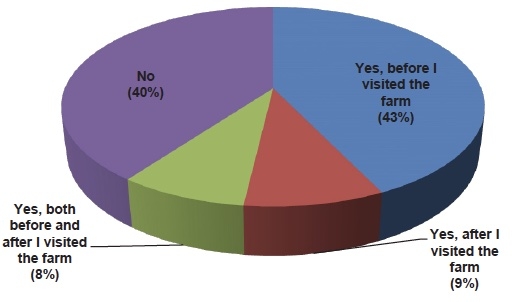
Figure 8. Have you visited the farm’s website? (n = 133)
Acknowledgments
We would like to extend our gratitude to the six North Carolina farms that assisted us with this study. Without the interest and participation of these farms and farmers, this study would not have been completed. We would also like to acknowledge and thank Southern Region Sustainable Agriculture Research and Education (SSARE) for funding this project. This project was funded through an SSARE OnFarm Research Grant.
Prepared By
Shuangyu Xu, graduate student
Parks, Recreation and Tourism Management
North Carolina State University
Samantha Rozier Rich, Assistant Professor and Tourism Extension Specialist
North Carolina State University

Sustainable Agriculture Research & Education
Publication date: Jan. 1, 2012
AG-760
N.C. Cooperative Extension prohibits discrimination and harassment regardless of age, color, disability, family and marital status, gender identity, national origin, political beliefs, race, religion, sex (including pregnancy), sexual orientation and veteran status.