
Introduction
This project, funded by the U.S. Geological Survey, Southeast Climate Science Center, is a pilot study to help inform climate adaptation planning for cultural resources. The National Park Service (NPS) estimated that over $40 billion dollars of coastal cultural resources and park infrastructure are at “high risk” from sea level rise (Peek et al. 2015). It is unlikely that the NPS will be able to preserve all of these assets into the future due to the vulnerability and financial constraints that have resulted in a backlog of deferred maintenance. As a result, managers will need to make informed decisions about which cultural resources to prioritize for climate adaptation actions.
Current NPS policy guidance indicates that managers prioritize the most vulnerable and the most significant resources (National Park Service 2014). Although the NPS employs a process to assess climate change vulnerability, there is no guidance for determining the significance of cultural resources or for determining how climate adaptation may impact the significance of cultural resources. We conducted a series of workshops and meetings to develop a measurement framework for evaluating and assessing the relative historical significance and use potential of historic buildings. We also established decision rules for how specific adaptation actions would impact historical significance. In this publication we (1) present an overview of the process we used to develop the measurement framework and (2) describe how the framework can be used as a guide for measuring the historical significance and use potential of buildings.
We developed this framework using Cape Lookout National Seashore (CALO), located on a 56-mile long chain of barrier islands on the North Carolina coast, as study site. CALO’s cultural resources range from historic districts Portsmouth Village and Cape Lookout Village with historic buildings and structures to archeological sites and a feral horse population. Given such diversity and the range of values affiliated with them, CALO managers helped us strategically select a set of 17 historic buildings within both historic districts for this pilot project. This set of historic buildings represents a range of buildings with differing physical exposures to climate change hazards, building conditions, and purposes of occupation.
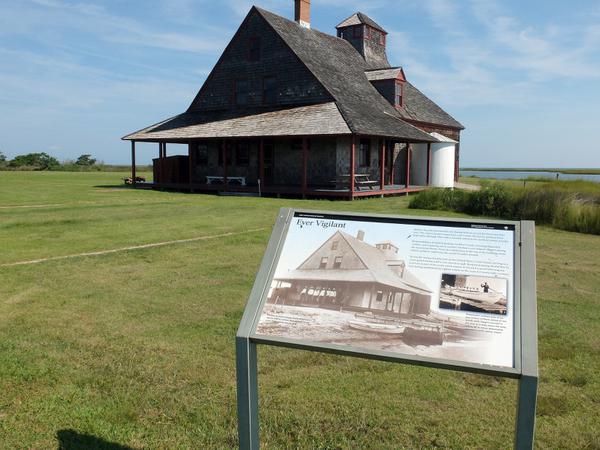
Portsmouth Village Life-Saving Station (built in 1894).
Erin Seekamp
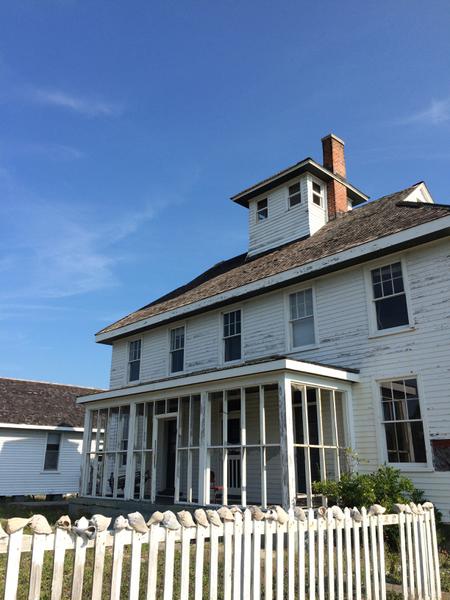
Cape Lookout Village Coast Guard Station (built in 1916).
Malorey Henderson
An Iterative Process for Developing the Framework
A series of four workshops and five meetings were carried out to develop a standardized approach to measuring the relative significance of historic buildings (Figure 1). The workshops were designed to encourage open dialog and inclusion of the diverse perspectives and experiences of our invited participants. The meetings were designed to elicit specific and detailed information from authorized decision makers for the buildings at CALO. This iterative process enabled and facilitated co-learning among researchers, practitioners, managers, and policy-makers.
Workshop I was held at CALO Headquarters in Harkers Island, North Carolina in December 2015. Participants in this five-day workshop included NPS personnel from CALO, the Climate Change Response Program, the Washington Support Office, and the Southeast Regional Office. Also in attendance were representatives from the North Carolina State Historic Preservation Office (SHPO) and key regional stakeholders, including representatives from CALO’s two partner organizations (Friends of Portsmouth Island and the Core Sound Waterfowl Museum & Heritage Center) and experts in North Carolina coastal dynamics, tourism, and historic preservation. The workshop began with several presentations about the historic districts, ongoing management challenges, the vulnerability of coastal resources, national and state policies, and an overview of the project’s goals. By the end of the week, facilitated discussions resulted in an initial list of attributes (see Box 1) that could be included in the framework to measure historical significance.
Box 1. Terms used in the measurement framework.
ATTRIBUTE: Characteristic that distinguishes differences between the objectives.
METRIC: Unit of measurement that is applied to each attribute.
SCORE: Numeric value that represents each level of a metric and the scaled difference between each level of a metric.
WEIGHT: Relative importance of one attribute in relation to another attribute.
Following the first workshop, a series of three meetings with CALO’s Park Superintendent and Chief of Resources (Meetings I through III) and a meeting with three representatives of North Carolina SHPO (Meeting IV) were held to refine the initial framework. Specifically, these meetings enabled the selection of attributes and metrics (see Box 1) for assessments of buildings’ historical significance. These meetings revealed that the use potential of historic buildings should also be considered during climate adaptation planning and decision-making. The identified attributes and their corresponding metrics were based on the following considerations: (1) what data sources already exist; and (2) what potential data sources exist that can provide well-defined measures of historical significance and use potential.
Workshop I participants vetted the preliminary measurement framework by completing an online survey that elicited feedback on the defined attributes and their metrics. The survey was also used to derive scores for each metric, and weights among different attributes of historical significance and use potential (see above). After collecting the online survey responses, an average score was calculated for each metric (Figure 2 and Figure 3). This average score provides a more informed way to determine the scaled difference between each level of a metric, rather than artificially assuming each level is equally distant from the next level. When applied in practice, each building under consideration would receive a total value score that is created by (1) applying a score for each sub-attribute and attribute; (2) normalizing (transforming) the scores to allow for direct comparison across the different sub-attributes and attributes by making each score on a 0.0 to 1.0 scale; and (3) calculating a weighted average of the normalized scores, using the weights assigned to each sub-attribute or attribute.
Workshop II was held at CALO Headquarters in Harkers Island, North Carolina in November 2016. This three-day workshop was attended by NPS personnel from CALO, the Climate Change Response Program, the Washington Support Office, and the Southeast Regional Office; representatives from the SHPO; and climate change vulnerability researchers from Western Carolina University. During this workshop, the measurement framework was presented and evaluated within the context of a larger decision support tool for climate adaptation planning developed by USGS that included vulnerability scores, historical significance scores, use potential scores, and an annual budget allocation to determine the optimal adaptation actions for the 17 historic buildings during a 30-year planning horizon. The measurement framework was restructured with the addition of two new attributes for use potential (third-party and scientific use), and some minor changes were determined for the historical significance attributes and their sub-attributes. Two additional workshops (Workshop III and Workshop IV) for eliciting the weights among attributes of historical significance and use potential were organized for 2017 to further vet the weighting of the attributes and sub-attributes with a wider audience.
As the second workshop resulted in new attributes for use potential (and the minor changes in historical significance attributes and sub-attributes), an in-person meeting with CALO’s Park Superintendent and Chief of Resources was held in January 2017 (Meeting IV). During this meeting, new metrics and scores were developed for the two new use potential attributes. Given these revisions to the measurement framework, we elicited preferred weighting schemes among the sub-attributes and the attributes, as well as between historical significance and use potential, from the second workshop participants through a second online survey in February 2017.
We presented the measurement framework to a wider audience at Workshop III (March 2017), which was held in Washington, DC prior to the Annual Meeting of State Historic Preservation Officers Conference. This workshop was attended by representatives from SHPOs of Delaware, New Mexico, Ohio and Virginia, together with representatives of Maryland Historical Trust and the non-governmental organization U.S. International Council on Monuments and Sites (ICOMOS). During this workshop, participants provided verbal feedback on the measurement framework and completed a paper survey for assigning weights among the attributes and sub-attributes and between historical significance and use potential. Similarly, Workshop IV aimed to elicit additional feedback on the measurement framework and preferred weighting schemes among attendees of the George Wright Society Conference in Norfolk, Virginia (April 2017). Four participants representing cultural resource management in the NPS, academia, and architectural consulting completed the paper survey for assigning weights.
The final measurement framework contains four historical significance attributes (association to fundamental purpose of park, condition of building, historical and unique character, and national register eligibility and geographical scope) and five use potential attributes (operational use, third-party use, visitor interpretive use, and scientific use). Descriptions and metrics for each attribute and sub-attribute are provided in Table 1 (historical significance) and Table 2 (use potential). The following sections of this publication provide visualizations and descriptions of the measurement framework. These figures display attribute metrics and scores as well as the average weights among sub-attributes and attributes and between historical significance and use potential. The weights displayed are based on the average responses provided by Workshop II, Workshop III, and Workshop IV participants. The final section of this publication provides a brief summary and narrative of ongoing efforts.
| Attribute | Association to Fundamental Purpose | Condition of the Building1 | Character | National Register | ||
|---|---|---|---|---|---|---|
| Defining Character | Uniqueness to Park | Spatial Significance | Eligibility | |||
| Description |
Fundamental cultural resources are resources that maintain a park unit’s purpose and significance and are of primary consideration during planning and management. This attribute uses the information on listed fundamental resource(s) in the park unit’s Foundation Document.2 |
The NPS database List of Classified Structures (LCS) is used to assess the condition of the historic building. Review of existing data is necessary as buildings are evaluated by park staff once every five years.
LCS is inventory of all historic and prehistoric structures/buildings that have historical, architectural, or engineering significance within parks of the NPS. Condition categories are assigned to structures/buildings as Good, Fair, or Poor. |
This sub-attribute refers to the historic building’s chronologic development in the historic district of the park unit. Using expert knowledge and technical judgement, this attribute evaluates whether a building is the primary (historic) reason that resulted in the development (or resettlement) of the historic district, or is part of the secondary development (or resettlement) of the historic district that occurred because of the original construction. |
This sub-attribute considers the original (historic) function of the building, whether its function was unique within the park unit or if there are a number of buildings with the same or similar function. Expert knowledge and technical judgement is used in this evaluation. It is important to note that this sub-attribute focuses on the type of building (e.g., private residence, school, church) and how many other similar types of buildings are in the park unit and within the region.< | The geographical scale of a building’s historic context listed in the National Register of Historic Places (NRHP)3 is used to assess the spatial significance sub-attribute.
The NRHP defines three geographic scales for a cultural resource’s historic context – national, state, or local – that can relate to a pattern of historic development, a political division, or a cultural area.4 |
The eligibility sub-attribute assesses whether or not the historic building is eligible for listing in the NRHP.4 |
| Metrics |
|
|
|
|
|
|
|
1 This attribute was originally defined as “integrity;” however, it became clear that the List of Classified Structures (LSC) scores, which were originally intended to measure the seven aspects of integrity, are most typically representative of the building’s condition. It is hoped that the measurement framework can be refined when the LSC score (or another system) is revised to truly reflect the seven aspects of integrity. |
||||||
| Attribute | Operational Use | Third-Party Use | Visitor Use | Interpretive Use | Scientific Use |
|---|---|---|---|---|---|
| Description |
This attribute explores current and future active uses of the historic building for the NPS administration, cultural resource maintenance, or other operational purposes (e.g., staff housing, visitor centers). Using expert knowledge and technical judgement, the attribute evaluates whether or not the historic building is used for park operations or has potential for it in the future. It also evaluates possible investment in the historic building for park operations in order to reduce the operational use of a non-historic (non-contributing) building. |
This attribute assesses a use of the historic building by the third party though lease agreements and concessions. Using expert knowledge and technical judgement, this attribute evaluates whether the historic building is currently used by the third party and if it is not, it evaluates if the potential to be used has been expressed or not. |
This attribute (using expert knowledge and technical judgement) explores current and future active uses of the building for public visitation within the historic district (or other specified area) of the park unit. This attribute also identifies whether the historic building has high, moderate, or low visitation. Levels of visitation are determined by judgment of park personnel or existing visitor use counts that can be binned into low, moderate, and high use levels. |
The park’s Long Range Interpretive Plan1 is used to assess current and future active uses of the historic building for communicating stories, educating and increasing visitors’ understanding and appreciation of the historic buildings in the park unit. This attribute focuses on whether the historic building’s interpretive plan conveys primary or secondary interpretive themes. |
This attribute is instrumental in pursuing and enhancing the historic building’s research interests and potential for scientific outcomes and activities. Using expert knowledge and technical judgement, the attribute evaluates whether or not the historic building has a potential to yield new scientific information and value. |
| Metrics |
|
|
|
|
|
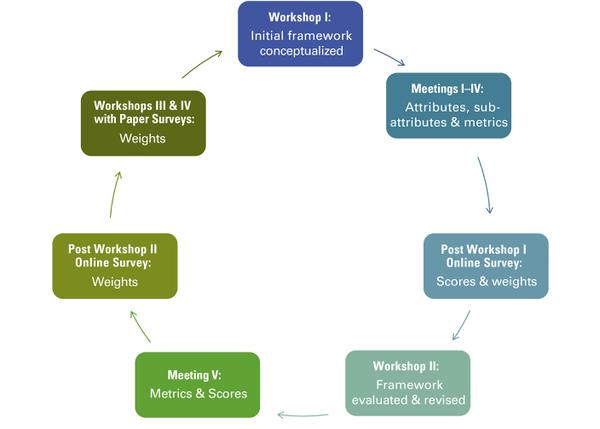
Figure 1. Process of developing a measurement framework.
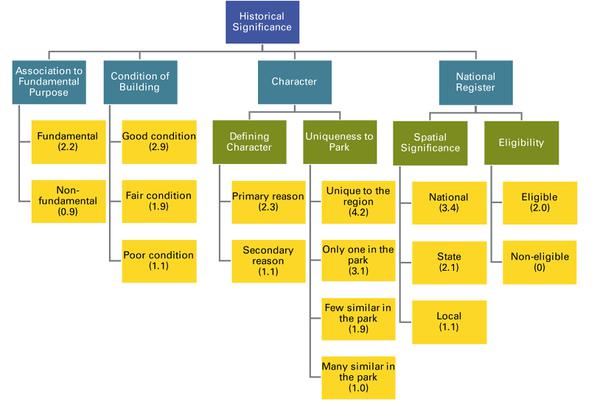
Figure 2. Diagram of historical significance with its attributes (in light blue boxes), sub-attributes (in light green boxes), and associated metrics with means scores (in yellow boxes).
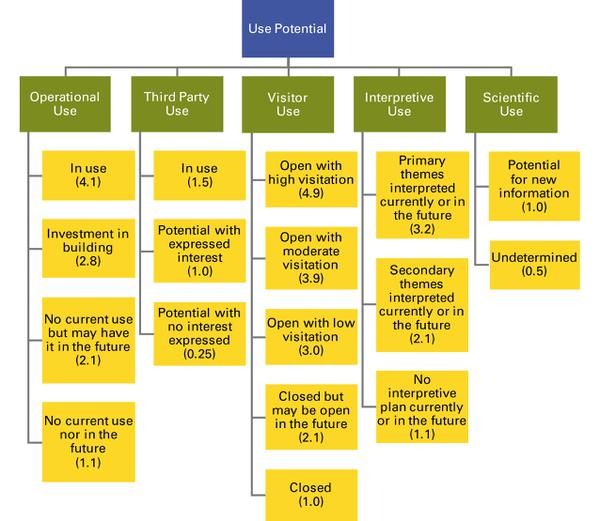
Figure 3. Diagram of use potential with its attributes (in green boxes) and associated metrics with mean scores (in yellow boxes).
Historical Significance
The historical significance construct incorporates the attributes associated with a building’s relationship to the purpose for a NPS site’s foundation, the current condition of the building, the character of the building, and listing information on the National Register of Historic Places (Figure 2). The numerical values associated with each metric are the scores that would be assigned to each building under consideration. These scores are then normalized and combined into a final score by taking a weighted average of the normalized scores. For detailed descriptions about the attributes, sub-attributes, and their metrics, see Table 1.
An example from Cape Lookout National Seashore is provided in Table 3, which is the Cape Lookout Lighthouse.
| Objective | Score | Normalized Score | Weight (Mean) | Weighted Normalized Value |
|---|---|---|---|---|
| Attribute | ||||
| Sub-attribute | ||||
| Historical Significance | 2.24 | 0.79 | 0.71 | |
| Association | 2.20* | 1.00 | 0.26 | |
| Condition | 1.90* | 0.44 | 0.17 | |
| Character | 2.72 | 0.82 | 0.27 | |
| Defining Character | 2.30* | 1.00 | 0.48 | |
| Uniqueness | 3.10* | 0.66 | 0.53 | |
| National Register | 2.04 | 0.75 | 0.30 | |
| Spatial Significance | 2.00* | 0.43 | 0.41 | |
| Eligibility | 2.00* | 1.00 | 0.59 | |
| Use Potential | 2.82 | 1.00 | 0.29 | |
| Operational | 4.10* | 1.00 | 0.17 | |
| Third Party | 1.50* | 1.00 | 0.12 | |
| Visitor | 4.90* | 1.00 | 0.17 | |
| Interpretive | 3.20* | 1.00 | 0.26 | |
| Scientific | 1.00* | 1.00 | 0.28 | |
| Final Importance Measurement | 0.85 | |||
| * Score assigned through the processes detailed in Table 1 and Table 2. | ||||
As the lighthouse is listed as a “fundamental” resource in a Park’s Foundation Document and it’s considered to be in “fair condition,” then it would be originally assigned a score of 2.2 for the “association to fundamental purpose” attribute and a score of 1.9 for the “condition of building” attribute. When these scores are normalized so that they are comparable, the building would receive a normalized score of 1.00 for the “association to fundamental purpose” attribute and 0.44 for the “condition of building” attribute. Once all of the scores are assigned for each sub-attribute and attribute, they are normalized and the weights (described in more detail in the Weighting section below) are applied so that each building under assessment will receive a final numeric measurement that is a weighted average.
Use Potential
The use potential construct considers the importance of current and future uses of historic buildings. The considerations for historic building uses (Figure 3) include use for park operations, third-party use, the building’s ability to enhance the public’s connection to interpretative themes, the extent of visitor access, and the potential for exploring new scientific information. Similar to historical significance (Table 3), the numerical values associated with each metric are the scores that would be assigned to each building under consideration. These scores are then normalized and combined into a final score by taking a weighted average of the normalized scores. See Table 2 for detailed information about the attributes and their metrics.
Weighting
Weights are assigned based on the relative importance of each attribute (and sub-attribute) and their relationships, both to each other and to historical significance and use potential (see Box 2). We asked the workshop participants to assign a value in the range of 0 to 100% to each set of sub-attributes, each set of attributes affiliated with each objective, and to the set of two objectives, where the summed value for each set equaled 100%. After collecting the responses, we averaged the weights for each set and then converted the averages to decimals (values between 0 and 1, with the total for each set equaling 1). Weights displayed in Figure 4 are averaged across responses from Workshop II, Workshop III, and Workshop IV participants. A larger weight indicates greater importance. The final measurement of the importance (accounting for both historical significance and use potential weighted, normalized scores) of the Cape Lookout Lighthouse is provided in Table 3.
Box 2. Weights example.
Assigned weights between two objectives:
a) historical significance = 0.71
b) use potential = 0.29
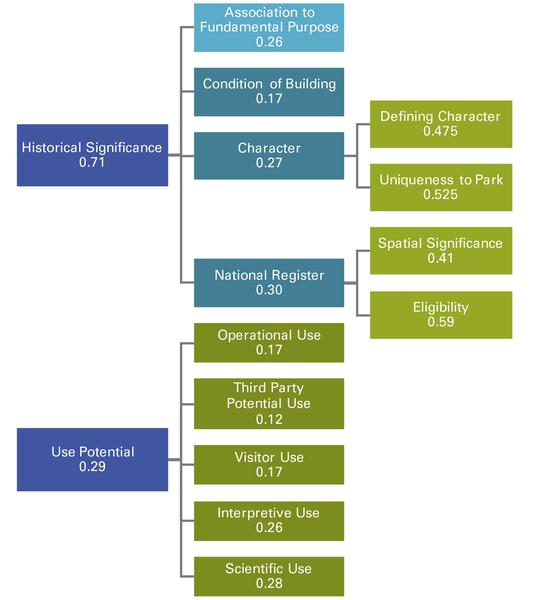
Figure 4. Weights (represented in numeric values) between historical significance and use potential objectives, and weights among attributes and sub-attributes within each objective.
Conclusions
We believe the measurement framework resulting from this iterative process provides a starting point for structuring decisions about climate adaptation planning for historic buildings. More specifically, we believe the framework can help managers distinguish between the relative importance of historic buildings in terms of their significance and their use potential. The weighting of these objectives (significance and use potential) and respective attributes and sub-attributes can either be applied as presented here or by undergoing a process to determine the weights that are most appropriate at the time of climate adaptation planning. For example, if managers determine that they only want to integrate the significance of historic buildings into decision-making, then they can simply weight significance as “1” and use potential at “0.”
Although the framework was developed with flexibility in mind, managers should also integrate measures of vulnerability into any future climate adaptation planning efforts to comply with current NPS policy (PM 14-02). Moreover, we also recommend that treatment costs be included in cultural resource climate adaptation planning efforts. We are currently working with project collaborators to develop a comprehensive decision support tool that is driven by annual budget allocations, measures of risk from climate change related coastal flooding, measures of historical significance, measures of use potential, and treatment costs for various adaptation actions. This tool selects the best adaptation actions over a 30-year planning horizon with the goal of retaining as much significance across a park’s landscape as possible. Additional research is necessary to develop measurement frameworks for considering the relative importance of other types of cultural resources in climate adaptation planning efforts.
References
National Park Service. 2014. Policy Memorandum 14-02: Climate Change and Stewardship of Cultural Resources.
Peek, Katie M., Robert S. Young, Rebecca L. Beavers, Cat H. Hoffman, Brian T. Diethorn, and Shawn Norton. 2015. Adapting to Climate Change in Coastal Parks: Estimating the Exposure of Park Assets to 1 m of Sea-Level Rise. Natural Resource Report NPS/NRSS/GRD/NRR—2015/961. Fort Collins, CO: National Park Service.
Project Information
This document was developed by Sandra Fatorić and Erin Seekamp as a part of the Connecting Landscape Adaptation and National Cultural Resource Policy to Climate Change and Cultural Resource Adaptation Decisions research project. This research was supported by the U.S. Geological Survey (http://www.usgs.gov/) through the National Climate Change and Wildlife Science Center and the Department of Interior Southeast Climate Science Center through grant agreement G15AP00141.
Principal Investigator
Erin Seekamp, Department of Parks, Recreation and Tourism Management, NC State University
Collaborators
Jordan Smith, Department of Environment and Society, University of Utah
Matthew Booker, Department of History, NC State University
Nils Peterson, Department of Forestry and Environmental Resources, NC State University
Stacy Nelson, Department of Forestry and Environmental Resources, NC State University
Acknowledgments
We would like to thank those individuals who participated in any one or multiple workshops, as well as our collaborators Mitch Eaton (USGS), Max Post van der Burg (USGS), Ellen Bean (consultant), and Elise Irwin (USGS). We are particularly appreciative of the time, creative energy, and support provided by specific NPS personnel: Pat Keeney, CALO Park Superintendent; Jeri DeYoung, CALO Chief of Resources; Curtis Rintz, CALO Exhibits Specialist; Janet Cakir, Southeast Region Climate Change, Socioeconomics, and Adaptation Coordinator; Cat Hoffman-Hawkins, Climate Response Program Chief; Marcy Rockman, Climate Change Adaptation Coordinator for Cultural Resources; and Brian Goeken, Technical Preservation Services Chief. We are also particularly appreciative of the time, creative energy, and support provided by the NC State Historic Preservation Office (Ramona Bartos, Deputy State Historic Preservation Officer; and John Wood, Preservation/Restoration Specialist).
Recommended Citation
Fatorić, S., and Seekamp, E. 2017. Assessing Historical Significance and Use Potential of Buildings within Historic Districts: An Overview of a Measurement Framework Developed for Climate Adaptation Planning. AG-832. Raleigh, NC: NC State Extension.
Publication date: May 25, 2017
AG-832
N.C. Cooperative Extension prohibits discrimination and harassment regardless of age, color, disability, family and marital status, gender identity, national origin, political beliefs, race, religion, sex (including pregnancy), sexual orientation and veteran status.