
Woodland owners harvest trees for financial and personal reasons. Deciding when is the optimal time to harvest is difficult for most woodland owners. However, this important decision strongly dictates future condition, growth, and composition of the next stand of trees and, ultimately, your bottom line. Some basic economic principles can help you make harvesting and other key woodland management decisions. Using loblolly pine in North Carolina as an example, we demonstrate the optimal time to harvest based on financial maturity.
Financial maturity is when the rate of value increase1 of your timber equals an alternative investment’s rate of return.2 From a strictly financial standpoint, the time to harvest is when the two rates are equal. This example can be developed for any species and region in the state.3
1 Rate of value increase is the combination of both the annual volume growth a tree has each year and the value increase the market places on various wood products based on size and quality.
2 Comparable alternative investments are often bonds or CD notes due to similarity in duration, liquidity, and risk.
3 A local professional forester is capable of developing a similar process for your region. This technique works for merchantable trees only.
Volume Growth of Trees
A tree has a fairly predictable volume growth rate. We can track how much wood a tree adds over a given time period (Figure 1). After several decades of vigorous development, growth rates slow, level out, and eventually decline with increasing age. Even after the growth rate levels out, there is often still a large amount of volume growth occurring. However the rate of volume growth slows to the point where the market value of next year’s growth falls below the rate of an alternative investment.
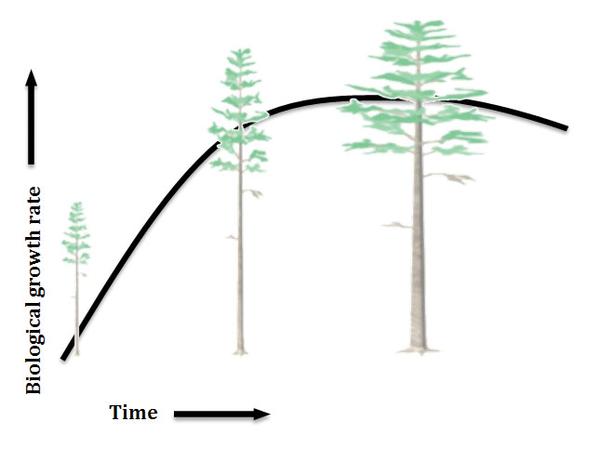
Figure 1. The biological growth rate of a tree (black curve) peaks at roughly 30–60 years, depending on species and site. Although trees may continue to live and grow for hundreds of years beyond this point, the peak indicates the financial maturity.
Value Growth of Trees
The value of a tree is influenced not only by biological growth rate but also by species, quality standards, and available markets. Value increases with size in a stair-step fashion (Figure 2).
Maximizing the value of trees often requires patience (while enjoying your forest) until your timber achieves the highest product class possible, such as sawtimber, poles, or veneer. As higher product classes are reached, volume growth rates start to decline, lessening next year’s value growth. As the trees’ value growth falls below your acceptable rate, the trees are considered to be financially mature and, in economic terms, ready for harvest. At this point, you will need to decide if it is time to thin or harvest the trees.
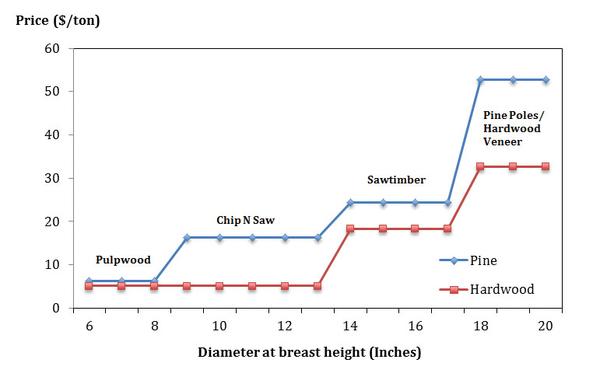
Figure 2. Stumpage of various timber product classes in North Carolina.
Simple Method for Estimating Financial Maturity of a Stand of Trees
Our simplified approach to estimate the volume growth of a stand of trees is expressed as percent annual compound interest. Volume growth is then converted to value growth to assess financial maturity. This approach is based on assumptions covering a wide range of tree growth rates and site productivity. A variation of this method based on merchantable height growth can be found in the appendix of AG 640, Timber Sales: A Planning Guide for Landowners.
Step 1) Estimate volume growth expressed as a percent annual compound interest
Estimating volume growth expressed as a percent annual compound interest requires information on the site productivity, average tree age, average tree diameter, and average tree diameter growth.4 Several pieces of this information may already be available in your forest management plan or can be obtained from the forester who designed the plan. If the data is unavailable, you can collect it by sampling several of the most vigorous crop trees. The crop trees selected for sampling should be among the tallest and straightest of the species you want to harvest and from the stand you are considering, often referred to as “dominant” or “co-dominant” trees in the stand.5 From these trees collect the following information.
a) The average age of the trees:
Estimated from a growth core extracted with an increment borer. Age is determined by counting the number of rings from the center of the tree.
b) The average 10-year diameter growth (inches):
Using the same growth core in (a), estimate diameter growth by measuring (in inches) the outer 10 growth rings. This figure represents the radial growth (in inches) of the tree for the past 10 years. For diameter growth, multiply this measurement by 2.1.6
c) The average DBH (measured in inches):
DBH can be measured using a diameter tape, Biltmore stick7 or by measuring the circumference of the tree and converting it to a diameter.
Converting circumference to diameter
c ÷ π = DBH
Where: c is circumference of the tree in inches at 4.5 feet above the ground line.
π is 3.14159
DBH is diameter of the tree in inches at 4.5 feet above the ground line
Example:
c = 44 inches
c ÷ π = DBH
44 inches ÷ 3.14159 = DBH
14 inches = DBH
d) Site productivity for the stand of trees:
Site productivity is a function of soil productivity and other environmental factors and is expressed as site index. Site index estimates (a measure of productivity) for a stand of trees can be determined from tree height measurements and a site index table or obtained from the Natural Resources Conservation Service county soil surveys.
Other possible sources for determining site index are professional foresters or North Carolina Forest Service county rangers. If you have a management plan for your woodlands, it is likely you already have that estimate, as it is a common measure in forest management planning.8
Using trees’ average age, average diameter growth, average DBH, and site index, determine the growth rate in percent annual compound interest from the table below (Table 1). The growth rates in Table 1 are based upon merchantable volume growth only. The stand of trees’ average DBH determines the appropriate line in the table, while age, site index, and growth rate determine the correct column.
Here is an example of how to use Table 1: Use left column to enter appropriate DBH. Use top headings to enter age, site index, and DBH growth. Information for a stand of loblolly pine trees: The average age of dominant and co-dominant trees is 30 years, the site index is 74, the average DBH of the co-dominant and dominant trees is 16 inches, and the average 10-year diameter growth is 3 inches. The 10-year tree volume growth expressed as a percent annual compound interest is increasing at 6 percent.
| Age of trees (site index) |
20 to 50 years (Site Index: 60-80) (moderate sites) |
20 to 50 years (Site Index: 90+) (best sites) |
50+ years (Site Index: Any) |
||||||||||||
| Past 10-year DBH growth (in) | 1" | 2" | 3" | 4" | 5" | 1" | 2" | 3" | 4" | 5" | 1" | 2" | 3" | 4" | 5" |
| Stand's Average DBH | |||||||||||||||
| 6" | 8 | 12 | 15 | 18 | 20 | 10 | 14 | 17 | 19 | 23 | -- | -- | -- | -- | -- |
| 8" | 5 | 8 | 10 | 13 | 15 | 7 | 9 | 12 | 15 | 17 | -- | -- | -- | -- | -- |
| 10" | 5 | 6 | 9 | 10 | 12 | 6 | 8 | 10 | 14 | 14 | -- | -- | -- | -- | -- |
| 12" | 4 | 6 | 7 | 9 | 10 | 5 | 7 | 9 | 11 | 12 | 2 | 4 | 6 | 7 | 9 |
| 14" | 4 | 5 | 7 | 8 | 9 | 5 | 7 | 8 | 10 | 11 | 2 | 3 | 5 | 6 | 7 |
| 16" | 3 | 5 | 6 | 7 | 8 | 5 | 6 | 8 | 8 | 10 | 1 | 3 | 4 | 5 | 6 |
| 18" | 3 | 4 | 5 | 6 | 7 | 5 | 6 | 7 | 8 | 9 | 1 | 2 | 4 | 5 | 6 |
| 20" | 3 | 4 | 5 | 6 | 7 | 4 | 5 | 6 | 7 | 8 | 1 | 2 | 3 | 4 | 5 |
| 22" | 3 | 4 | 5 | 5 | 6 | 4 | 5 | 6 | 7 | 8 | 1 | 2 | 3 | 4 | 5 |
| 24" | 3 | 4 | 4 | 5 | 6 | 4 | 5 | 6 | 6 | 7 | 1 | 2 | 3 | 3 | 4 |
|
Note: This table was built using estimates of annual percent board foot volume growth rate expected of a stand of trees during a 10- year period. This is based on the average age of the trees, site productivity, and measured 10-year diameter growth at dbh. |
|||||||||||||||
Step 2) Estimating value growth expressed as a percent annual compound interest
If standing timber (stumpage) prices were the same at the beginning and end of the growth period (10 years), then value growth would be identical to volume growth. This is usually not the case. Both inflation and the relative scarcity of larger trees tend to increase stumpage prices over time. To convert volume growth to value growth, you need price information for the end and beginning of the current 10-year growth period. For North Carolina, this price information is available online from Extension Forestry. This price information is used to calculate a simple price ratio (price at the end of 10 years divided by price at the beginning of 10 years) that is needed to enter Table 2. To calculate the price ratio use the following equation:
Price ratio = (Yn + 10) ÷ Yn
Where, Yn+10 is the price value at the end of the 10-year growth period, and Yn is the price value at the beginning of the 10-year growth period.
For example: Pine sawtimber sold at $20 per ton ten years ago. Now pine sawtimber is selling at $30 per ton. The 10-year price ratio is:
Price ration = (Yn + 10) ÷ Yn = $30 ÷ $20 = 1.5
This price ratio is then used to enter Table 2, along with the percent annual volume growth from Table 1, to determine the value growth of trees as expressed as percent annual compound interest. It is this percent annual compound interest that is compared to other investments to determine if the stand of trees is financially mature.
Here is an example of how to use Table 2: As an example, the price ratio of 1.5 (50 percent increase in 10 years, or 4 percent annual compound interest rate) is applied to the example from Table 1. Growing at 6 percent gives a value growth rate of 10.1 percent per year. If other investment opportunities had alternative rates of returns greater than this, it would make financial sense to harvest at this point. However, if alternative rates of return are less than 10.1 percent and there is no pressing need to harvest, it may be prudent to continue to grow the stand.
For a worksheet that you can use in calculating value growth of trees expressed as percent annual compound interest, see the Cutting at Financial Maturity Worksheet below.
| Percent annual volume growth (from Table 1) | ||||||
| price ratio | 1 | 2 | 4 | 6 | 8 | 10 |
| 1 | 1 | 2 | 4 | 6 | 8 | 10 |
| 1.2 | 2.8 | 3.8 | 5.8 | 7.8 | 9.8 | 11.8 |
| 1.5 | 5.1 | 6.1 | 8.1 | 10.1 | 12.1 | 14.1 |
| 1.8 | 7.1 | 8.1 | 10.1 | 12.1 | 14.1 | 16.1 |
| 2.2 | 9.2 | 10.2 | 12.2 | 14.2 | 16.2 | 18.2 |
| 2.6 | 11.0 | 12.0 | 14.0 | 16.0 | 18.0 | 20.0 |
| 3.1 | 13.0 | 14.0 | 16.0 | 18.0 | 20.0 | 22.0 |
4 Measurements for average tree age, diameter, and diameter growth are all taken at 4.5 feet above the ground line, referred to as breast height, BH. This diameter is diameter at breast height (DBH).
5 Dominant tree crowns extend above the general level of the woodland canopy, receiving full light from above and partial light from the sides. Co-dominant tree crowns are the same height as the woodland canopy, receiving full light from above and comparatively little light from the sides.
6 Multiplying by radial growth 2.1 converts to diameter and also adds an adjustment for bark thickness. The result is the diameter growth based on DBH outside the bark.
7 To learn more about how to use a scale stick, read Woodland Owner Note No. 5, Estimating the Volume of a Standing Tree Using a Scale (Biltmore) Stick.
8 For more on site index, see Woodland Owner Note No. 7, Forest Soils and Site Index.
Conclusion
Percent growth is one technique for deciding the optimal economic harvest time (thin or harvest) for a financially mature stand of trees or woodlot. Still, it is only a guide. Market fluctuations alone can offset several years’ growth. When you do decide to cut, professional advice and assistance are always recommended to receive top dollar for your harvest and best productivity for your future stand. Most stands can be managed many years beyond strict financial maturity before stagnation or potential catastrophe begins to force regeneration or a timber sale. Therefore, percent growth or any other determination of financial maturity must be accompanied by a comprehensive management plan and sound marketing strategy.
Cutting at Financial Maturity Worksheet
Worksheet for calculating value growth of trees expressed as percent annual compound interest.
| 1. Average age of the trees (years) | ___________ |
| 2. Average diameter of the trees at 4.5 feet above the ground (inches) | ___________ |
| 3. Average diameter growth of the trees for the past 10 years (inches) | ___________ |
| 4. Site index for the stand of trees (base age 50) | ___________ |
| 5. 10-year volume growth expressed as annual compound interest (percent) | ___________ |
| 6. Stumpage price at the beginning of the 10-year period ($/ton) | $___________ |
| 7. Stumpage price at the end of the 10-year period ($/ton) | $___________ |
| 8. Price ratio [line 7 divided by line 6] | ___________ |
| 9. Expected rate of return for 10-year period expressed as annual compound interest (percent) | ___________ |
Explanation by line
1. Calculated by extracting a growth core using an increment borer. Age is determined by counting the number of rings from the center of the tree.
2. Diameter can be measured using a diameter tape, Biltmore stick or by measuring the circumference of the tree and converting it to diameter.
3. Determined by extracting a growth core and measuring the distance of the last 10 growth rings. The core’s last 10 growth rings length is multiplied by 2.1 to convert to diameter and compensate for bark growth. For example if the core’s last 10 growth rings length is 0.5 inches and it is multiplied by a factor of 2.1 the diameter growth for the 10-year period is approximately 1 inch.
4. Determined from tree height measurements and a site index table or obtained from the Natural Resources Conservation Service county soil surveys. Other possible sources for determining site index are assistances from a professional forester or North Carolina Foresty Service county ranger.
5. Determined by using the data in lines 1-4 to enter Table 1 for value.
6. Determined from records of past sales, consulting foresters, forest industry, price reporting agencies, or by contacting state forest service or Cooperative Extension. In North Carolina price data is available from Extension Forestry. Stumpage price is the price paid to the landowner for standing timber prior to harvest.
7. See the explanation for line 6.
8. Determined by dividing the stumpage price at the end of the 10-year period you are interested in by price at beginning of the 10-year period.
9. Determined by using the data in lines 5 and 8 to enter Table 2 for value.
Another way of thinking about it: comparing growth per acre with value growth percent
Two ways to look at value growth of a stand of trees are value growth per acre and value growth percent. When land is limited, managers sometimes try to maximize value and growth per acre. A stand might be scheduled for harvest when it no longer produces, for example, 500 board feet (or its economic equivalent, depending on markets, say $60) per acre per year. You should compare this per-acre amount with other income opportunities, such as crops.
Money is more limited than land in most investment situations. Managers therefore try to maximize return per dollar. To do this, value growth of trees (or stands) is more usefully expressed as percent, to compare with rates of return possible through alternative investments. When a stand’s stumpage value (the capital tied up in a stand) could earn more in alternative investments (a higher percentage), then the stand is financially mature.
These two methods of evaluating the adequacy of timber growth can lead to quite different answers. For example, a stand containing 5,000 board feet per acre and growing 500 board feet per acre per year is returning 10 percent. Ten years later, the same stand should contain 10,000 board feet because each year’s growth has been automatically reinvested (tax free). However, the stand is now returning only 5 percent (500 on 10,000), even though the volume growth rate has remained constant. After converting percent volume growth to value growth, the investor with more attractive alternatives elsewhere would prepare to market this financially maturing timber stand.
Publication date: June 18, 2019
WON-62
N.C. Cooperative Extension prohibits discrimination and harassment regardless of age, color, disability, family and marital status, gender identity, national origin, political beliefs, race, religion, sex (including pregnancy), sexual orientation and veteran status.