
Introduction
North Carolina soybean producers face a wide diversity of foliar products that could impact their yield. Profit margins are currently narrow for soybeans, so it pays to put much thought into the potential yield advantages and costs associated with these products. Our goal at NC State University is to provide unbiased data on the impact of these products on soybean yield in diverse environments across the state. The NC State Soybean Extension program has been investigating how foliar products have affected yield for the past six years across the state. While products have varied from year to year, this trial has generally included foliar fungicides and foliar fertilizers. Over the years, we have been able to identify some trends, which we will discuss in this publication.
Materials and Methods
This study was conducted across 19 North Carolina environments from 2013 to 2018 (Table 1). At each location, standard grower production practices were used (variety, row spacing, seeding rate, soil-applied fertility). We asked growers not to apply foliar products to research plots. Instead, the Soybean Extension program applied the foliar treatments using a four wheeler-mounted sprayer and made applications based on targeted soybean growth stages. Each treatment was evaluated in four replications per location. We evaluated fungicides, stress reducers, and fertilizers (Table 2). Nutrients applied in foliar fertilizers varied between products (Table 3). Grain was collected using a small-plot combine. Soybean yield data is reported at 13 percent moisture. The data was analyzed using PROC Mixed in SAS 9.4. Estimate statements were used to compare treatments to a nontreated control. We consider a P-value <0.10 significant.
| County | Year | Average Yield | Agent | Grower |
|---|---|---|---|---|
| Cherokee | 2018 | 91 bu/A | Keith Wood | Ed Wood |
| Johnston | 2018 | 47 bu/A | Tim Britton | Keith Smith |
| Pender | 2018 | 25 bu/A | Mark Seitz | Don Rawls |
| Wake | 2018 | 45 bu/A | Emily Mueller | Ryan Broadwell |
| Alamance | 2017 | 56 bu/A | Dwayne Dabbs | Robert Saunders |
| Franklin | 2017 | 40 bu/A | Charles Mitchell | Bell and Bell Farms |
| Tyrrell | 2017 | 54 bu/A | Clayton Butcher | Green Valley |
| Alamance | 2016 | 34 bu/A | Dwayne Dabbs | Saunders Farm |
| Randolph | 2016 | 62 bu/A | Jon Wall | Nathan Johnson |
| Surry | 2016 | 49 bu/A | Tim Hambrick | Draughn Farms |
| Catawba/Caldwell | 2015 | 34 bu/A | Seth Nagy/George Place | Russell Hendrick |
| Wilson | 2015 | 49 bu/A | Norman Harrell | Sharp Farms |
| Greene | 2014 | 45 bu/A | Roy Thaggard | Tommy Hardy |
| Johnston | 2014 | 24 bu/A | Tim Britton | Batten Farms |
| Pamlico | 2014 | 55 bu/A | Daniel Simpson | Spencer Farms |
| Bertie | 2013 | 16 bu/A | Richard Rhodes | Ed Rawls |
| Hertford | 2013 | 22 bu/A | Wendy Burgess | Jay Revelle |
| Pasquotank | 2013 | 69 bu/A | Al Wood | Jeff Small |
| Union | 2013 | 51 bu/A | Andrew Baucom | Cox Brothers |
| Type of Product | Product | Timing | Rate Used | Year/Years Evaluated |
|---|---|---|---|---|
| Fungicide |
Headline (1 MOA*) |
R2-R3 | 6 oz/A | 2013, 2014, 2015, 2016 |
| Fungicide |
Quadris (1 MOA*) |
R2-R3 | 6.2 oz/A | 2013, 2014, 2015 |
| Fungicide |
Domark (1 MOA*) |
R2-R3 | 4 oz/A | 2013, 2014, 2015 |
| Fungicide |
Topguard (1 MOA*) |
R2-R3 | 12 oz/A | 2013, 2014, 2015, 2016 |
| Fungicide |
Stratego Yld (2 MOA*) |
R2-R3 | 4.5 oz/A | 2013, 2015, 2016, 2017, 2018 |
| Fungicide |
Quadris Top (2 MOA*) |
R2-R3 | 8 oz/A | 2013, 2014, 2015, 2016, 2017, 2018 |
| Fungicide |
Priaxor (2 MOA*) |
R2-R3 | 4 oz/A | 2013, 2014, 2015, 2016, 2017, 2018 |
| Yield Enhancer | Sugar | V2-V4 | 2 lb/100 gal | 2013, 2014, 2015, 2016, 2017 |
| Stress Reducer | Photon | V2/V4 + R2 | 16 g/A + 16 g/A | 2013, 2014, 2015 |
| Stress Reducer | Photon | V2-V4 | 16 g/A | 2014, 2015 |
| Stress Reducer | Photon | R2 | 16 g/A | 2014, 2015 |
| Foliar Fertilizer | BioForge + Sugar | V2-V4 | 16 oz/A + 2 lb/100 gal | 2014, 2015, 2016 |
| Foliar Fertilizer | BioForge | V2-V4 | 16 oz/A | 2014, 2015, 2016 |
| Foliar Fertilizer | Soar Series I** | Pre-bloom, full-bloom, and post-bloom | 6 qt/A (total) | 2013, 2014, 2015, 2016, 2017, 2018 |
| Foliar Fertilizer | Soar Series II** | Pre-bloom and full-bloom | 4 qt/A (total) | 2013, 2014, 2015, 2016, 2017, 2018 |
| Foliar Fertilizer | IronMan | V2/V4 | 2 qt/A | 2016, 2017, 2018 |
| Foliar Fertilizer | IronMan | R2/R4 | 2 qt/A | 2016, 2017, 2018 |
| Foliar Fertilizer | IronMan | V2/V4 + R2/R4 | 2 qt/A + 2 qt/A | 2016, 2017, 2018 |
| Foliar Fertilizer | N-Boost | V2-7 + R2 | 1 qt/A + 1 qt/A | 2017, 2018 |
| Foliar Fertilizer | N-Boost | R2 | 2 qt/A | 2017, 2018 |
| Foliar Fertilizer | Smart Quatro | V5-7 | 1 qt/A | 2017, 2018 |
| Foliar Fertilizer | Smart B-Mo | R2 | 1 pt/A | 2017, 2018 |
| - | Nontreated | - | - | 2013, 2014, 2015, 2016, 2017, 2018 |
|
*MOA = mode of action. **Soar Series I consisted of 2 qt/A Soar Soybean Mix applied at each pre-bloom, full-bloom, and post-bloom. Soar Series II consisted of 2 qt/A of Soar Bloom Mix applied at pre-bloom and 2 qt/A Soar Soybean Mix applied at post-bloom. |
||||
| Foliar Fertilizer | Timing | Rate | Lbs nutrient applied/A |
|---|---|---|---|
| Soar Series I | V6/7 + R2 + R4 | 2 qt/A + 2 qt/A + 2 qt/A |
0.16 Ca 0.08 Mg 0.16 B 0.08 Fe 0.47 Mn <0.01 Mo 0.04 Zn |
| Soar Series II | V6/7 + R4 | 2 qt/A + 2 qt/A |
0.11 Ca 0.05 Mg 0.11 lb B 0.05 lb Fe 0.31 lb Mn <0.01 lb Mo 0.03 lb Zn |
| IronMan | V2/4 | 2 qt/A |
0.90 N 0.14 S 0.23 Fe |
| IronMan | R2 | 2 qt/A |
0.90 N 0.14 S 0.23 Fe |
| IronMan | V2/4 + R2 | 2 qt/A + 2 qt/A |
1.80 N 0.28 S 0.46 Fe |
| N-Boost | V2/7 + R2 | 1 qt/A + 1 qt/A | 0.1 N |
| N-Boost | R2 | 2 qt/A | 0.1 N |
| Smart Quatro | V5/7 | 1 qt/A |
0.04 S 0.06 B 0.08 Mn <0.01 Mo 0.08 Zn |
| Smart B-Mo | R2 | 1 pt/A |
0.07 B <0.01 Mo |
Results and Discussion
We have evaluated a diversity of products over the past six years in these trials. This report will focus on results from products that have been evaluated over multiple years. We will not discuss the following products/treatment timings, which were evaluated for one year only: Nutran applied at V3/V4, pre-bloom, R1, and post bloom; BioForge applied at R2; Boron applied at V2/V4; N-Boost applied at V2; and Smart Quatro applied at R2.
How did foliar fungicides impact soybean yield?
Growers often ask:
- “Should I invest in a fungicide application?”
- “What is the best timing for application?”
- “What is the best product?”
We cannot answer all these questions with the information generated from this trial, but we now have results about how fungicides impact soybean yield in a wide range of environments, and we can discuss some trends from these results.
Across the test environments, we noted two variables that can impact the effectiveness of fungicides.
1. Soybean variety: Soybean genetic packages vary in their resistance to certain foliar diseases.
2. Environmental conditions: Heat, moisture, disease pressure, and soybean biomass production can impact foliar disease. This factor varied by the environment.
The effect of fungicide use on soybean yield compared to the nontreated control can be found in Figure 1.
When we combined over 19 trial environments and the various fungicide products evaluated, we found that fungicide use provided a 2 bu/A yield advantage on average over the nontreated control (P=0.01). This yield advantage varied by environment; in some fields, fungicide use provided up to 8.9 bu/A yield increases, while in others it brought no increase. About 25 percent of the time, fungicide use led to a statistically significant yield advantage. The soybean yield advantage from the use of foliar fungicides at early reproductive development will vary across environments based on disease presence, environmental conditions that are conducive to disease development, and the resistance package of the soybean variety used in the trial. Another point to consider is that applying fungicides in the absence of observable disease increases the risk that pathogens may develop resistance to fungicides.
What about a single-MOA vs multi-MOA fungicide?
The multi-mode of action (MOA) fungicides evaluated (Priaxor, Quadris Top, Stratego Yld) provided a 2.5 bu/A yield advantage on average over the nontreated control, whereas the single-MOA fungicides only provided a 1.6 bu/A yield advantage on average over the nontreated control. The yield advantage provided by the double-MOA fungicides may indicate the presence of fungicide-resistant diseases that require additional inputs to manage. In addition to the yield increases from the use of a multi-MOA fungicide, using a multi-MOA fungicide is beneficial for fungicide-resistance management because you are reducing sole dependence on one MOA for disease control. Please see the North Carolina Soybean Production Guide (Table 8-2) for a list of single- and multi-MOA fungicides: https://content.ces.ncsu.edu/north-carolina-soybean-production-guide/soybean-disease-and-nematode-management.
How do these results relate to profit?
Fungicide product costs vary from grower to grower and distributor to distributor, but an average fungicide application would cost $7 to $15/A (with single-MOA products generally costing less in this range). That amount does not include the cost to run the sprayer across the field. In the end, fungicide use on average may provide a small profit increase. The profit impact varies based on disease pressure at the site, varietal resistance, and the selling price of soybeans. In this trial, only foliar fungicide applied at early reproductive development provided the most consistently positive impact on soybean profit compared with other foliar inputs evaluated.
Do sugar applications increase soybean yield?
Within the past few years, there has been discussion from entities outside NC State Soybean Extension regarding the benefits of applying sugar to field crops. We found that the application of sugar alone at V2/V4 (P=0.21) or in combination with BioForge (P=0.66) did not impact soybean yield and would not provide an economic advantage for use in North Carolina based on these results. Our findings are consistent with others across the United States showing no yield advantage from applying sugar to soybean crops. This conclusion is summarized by Shawn Conley at the University of Wisconsin-Madison: A Tank Full of Sugar Helps the Profits Go Down.
How do ‘stress reducers’ impact soybean yield?
There is an advantage to evaluating products aimed at reducing stress on soybean crops—stress will reliably occur at some point throughout these evaluations. Photon is a foliar product that is advertised to aid in keeping a crop productive under environmental stressors (heat, cold, or drought). It is manufactured by Crop Microclimate Management. In our trials, the use of this product did not impact soybean yield when applied at V2/V4 alone (P=0.52), R2 alone (P=0.61), or at both application timings (P=0.90). We assume that the soybean plants were under stress at some point in the nine environments where the product was applied and experienced drought, excess moisture, or disease.
Bioforge is a plant growth promoter that is marketed by Stoller USA to protect the plant from stress. It can be applied as a seed treatment, in-furrow, or as a foliar application. In this study, BioForge was evaluated as a foliar application at early vegetative growth (V2/V4). The application of BioForge alone at V2-V4 (P=0.80) or in combination with sugar (P=0.66) did not impact soybean yield at any environment. Again, we assume that the soybean plants were under stress at some point in the eight environments where the product was applied.
How did foliar fertilizers impact soybean yield in our trials?
We have evaluated several foliar fertilizer products over multiple years in this trial, including Soar Products, IronMan, N-Boost, Smart Quatro, and Smart B-Mo (Table 2). The amount of nutrients applied/A in these applications can be found in Table 3.
Soar Products: The Soar Series were evaluated over 19 environments. Soar Series I consisted of 2 qt/A Soar Soybean Mix applied at each pre-bloom, full-bloom, and post-bloom. Soar Series II consisted of 2 qt/A of Soar Bloom Mix applied at pre-bloom and 2 qt/A Soar Soybean Mix applied at post-bloom. On average, Soar Series I provided a 2.1 bu/A yield advantage (P=0.02) and Soar Series II provided a 1.9 bu/A yield advantage (P=0.04). Soar Series I would cost approximately $23/A, and Soar Series II would cost approximately $15/A. However, these costs are just for the product and do not include the additional cost of two to three additional trips across the field. Considering economics, the limited yield increase from the use of these products would not result in a profit under most circumstances.
IronMan: IronMan applied at early vegetative growth stages did not impact soybean yield (P=0.68). IronMan applied at early reproductive growth stages provided a slight yield advantage (+2.6 bu/A, P=0.03) and trended towards impacting yield when applied at both early and reproductive stages (+1.8 bu/A, P=0.14). IronMan applied at 2 qt/A is estimated to cost $3/A for the product plus the cost of the trip across the field.
N-Boost: The N-Boost product applied once or twice did not provide a yield advantage compared to the nontreated control (P=0.68, P=0.32) in the seven environments where the product was evaluated. Table 3 shows that N-Boost is supplying minimal nitrogen (<1 lb/A), a macronutrient needed in large quantities by soybean plants.
Smart Quatro: The Smart Quatro product did not provide a yield advantage compared to the nontreated control (P=0.15) in the seven environments where it was evaluated.
Smart B-Mo: The Smart B-Mo product did provide a 3.2 bu/A yield advantage compared to the nontreated control (P=0.04) when combined across seven environments. We assume the nutrients supplied by this product were deficient in some of these environments, although we do not have the tissue samples to verify this.
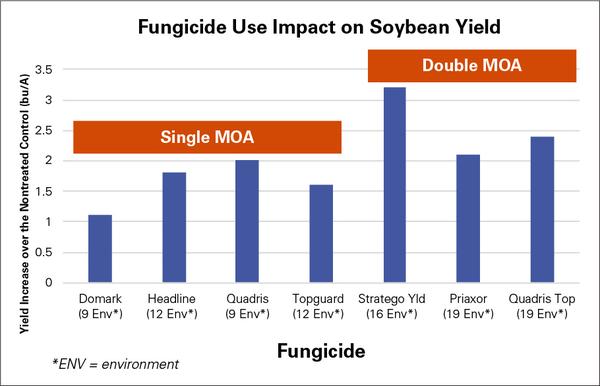
Figure 1. The impact of fungicide use on soybean yield in the NC State Soybean Extension foliar testing program from 2013-2018.
Conclusions
- Foliar fungicides sometimes led to statistically significant soybean yield increases. Double-MOA fungicides were more effective at increasing soybean yield on average than single-MOA fungicides.
- Sugar applications did not increase soybean yield
- Foliar fertilizer use sometimes resulted in a statistically significant soybean yield increase depending on which growth stage in which it was applied. There are cases where micronutrient deficiencies justify the use of a foliar fertilizer application, and yield increases can be observed in these situations.
What is the future of foliar yield enhancement testing in the Soybean Extension Program? Over the next two years, we will participate in a national collaboration with other U.S. soybean Extension specialists evaluating various foliar fertilizer products and their impact on yield. One of those partners will be Dr. Lindsey Thiessen, a plant pathologist at NC State who is one of the authors of this publication. We will work together to ensure growers have the data they need to make informed decisions regarding foliar fungicide use in soybeans across North Carolina.
Questions? Please contact Dr. Rachel Vann, soybean Extension specialist in the Crop and Soil Sciences Department at NC State, at rachel_vann@ncsu.edu or 919-616-6775.
Acknowledgments
This research was funded by the North Carolina Soybean Producers Association and their checkoff dollars.
Figure 2. Soybean farm test sign.
Publication date: June 20, 2019
AG-859
Recommendations for the use of agricultural chemicals are included in this publication as a convenience to the reader. The use of brand names and any mention or listing of commercial products or services in this publication does not imply endorsement by NC State University or N.C. A&T State University nor discrimination against similar products or services not mentioned. Individuals who use agricultural chemicals are responsible for ensuring that the intended use complies with current regulations and conforms to the product label. Be sure to obtain current information about usage regulations and examine a current product label before applying any chemical. For assistance, contact your local N.C. Cooperative Extension county center.
N.C. Cooperative Extension prohibits discrimination and harassment regardless of age, color, disability, family and marital status, gender identity, national origin, political beliefs, race, religion, sex (including pregnancy), sexual orientation and veteran status.