
Whatever its source, nitrogen is essential for achieving optimum yields of grain, forage, and other crops. The same is true of phosphorus and other nutrients. Applying too much nitrogen or phosphorus to cropland, however, can have adverse effects on the environment, particularly water quality. Excess nitrogen and phosphorus in surface waters can cause eutrophication (excess algae growth), and excess nitrogen in groundwater can cause health problems in humans and livestock when they drink water containing too much nitrate (a form of nitrogen). Farmers should aim to achieve optimum yields without applying excessive nutrients, thereby saving money and protecting the environment at the same time.
Effect of Nitrogen on Water Quality
Eutrophication is the slow, natural nutrient enrichment of streams, lakes, and estuaries that is responsible for the ponds, lakes, and reservoirs accumulating nutrients. Excessive amounts of nitrogen and phosphorus speed up the eutrophication process. These excess nutrients can cause an algae bloom, which is characterized by rapid algal growth and then subsequent die-off; the decomposition of the algae depletes oxygen in the water, which kills fish, causes odor problems, and impedes the use of water resources for recreation and public uses. Eutrophication has been observed throughout North Carolina reservoirs, streams, and estuaries.
Although nitrogen is an essential nutrient for humans, a form of nitrogen — nitrate — can cause human and animal health problems if the concentration is too high, particularly for infants younger than six months of age. The United States Public Health Service has established a specific standard of 10 milligrams per liter of nitrate nitrogen as the maximum concentration safe for human consumption. Cases of excessive nitrate consumption by humans, however, are extremely rare in the United States. Nitrate toxicity does occur in livestock, and the nitrate concentrations that produce toxicity are much higher than those for humans. Nitrate poisoning in livestock depends more on nitrate in feed than in water. Nitrate-contaminated water is usually a problem only when it adds to high nitrate concentrations already present in the feed being consumed by livestock.
Fate of Nitrogen in the Environment
The dynamics of nitrogen are complex (Figure 1), with nitrogen existing in many chemical forms in the soil (stored in the organic matter as organic nitrogen or in inorganic forms as ammonia, ammonium, nitrate, nitrite, nitric oxide, and nitrous oxide). The transformation among the inorganic forms can occur quickly and is largely controlled by soil microorganisms. The long-term fate of land-applied nitrogen is the same whether it comes from field-applied fertilizer; legume residues; animal, industrial, or municipal wastes; or other sources. The possible outcomes of this applied nitrogen are listed in the following sections.
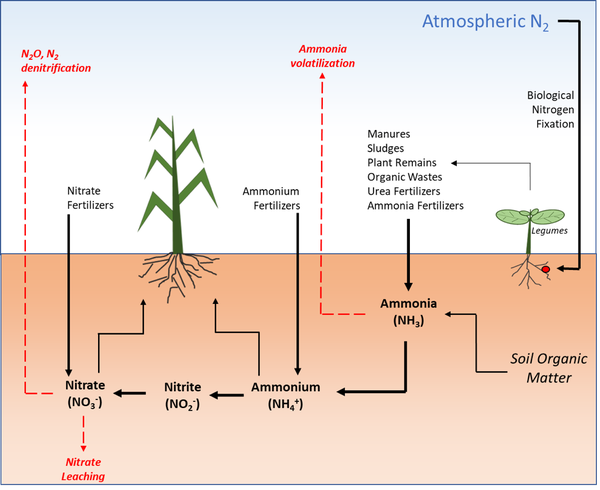
Figure 1. Nitrogen cycling in the soil.
Nitrogen Remaining in the Soil
The total nitrogen in cultivated soils remains relatively constant over a period of years. Most of the nitrogen is present in organic matter, which varies among soils and cropping systems on the same soil but is relatively constant for a particular soil on which a given crop rotation is used. Nitrogen primarily carries over from one crop to another within the soil organic matter. Increasing organic matter to increase soil nitrogen takes decades and generally requires an increase in additions of nitrogen fertilizer, legumes, or animal waste. Regardless of whether nitrogen is in the organic or inorganic form when applied to crops on North Carolina soils, it undergoes transformation to produce nitrate as an end product. Some soil nitrogen may carry over as nitrate, which can be lost from the soil through leaching; thus, soil nitrogen as nitrate rarely accumulates.
Recovery of Nitrogen in Harvested Crop
The amount of nitrogen removed by crop plants is generally between 30 and 75 percent of the applied nitrogen, but research demonstrates that this will vary by crops, soils, season, and climate (Osmond et al. 2011; Cahill et al. 2007, 2010, 2010a, 2011; Rajkovich et al. 2017, 2017a); the amount of nitrogen recovery is often referred to as nitrogen use efficiency or NUE. Research in North Carolina has shown that approximately 75 percent of the nitrogen applied to sod crops (such as bluegrass or coastal bermudagrass) is commonly recovered (Osmond et al. 2001). Typically, agronomic crops such as wheat and corn have an NUE of 40 percent to 65 percent, with nitrogen taken up in grain and straw or stover. Because crops are not 100 percent efficient in using all the nitrogen (derived from soil and fertilizer), even when the fertilization is well managed, excess nitrogen not used by the crop may be lost by leaching or runoff and potentially contribute to pollution of water resources. Fertilizer efficiency decreases with increasing nitrogen application rates, presenting a challenge in management of nitrogen fertilization. When fertilizer rates are below the optimum for maximum crop yield, nitrogen is used very effectively but maximum yields are not achieved. Conversely, to obtain maximum profit from crops, the fertilizer rates should be higher, decreasing the NUE and increasing the risk of environmental pollution. The challenge is determining the rate of nitrogen fertilizer to maximize yields and profitability while minimizing nitrogen losses.
Fertilizer Nitrogen Lost to Groundwater
Most plant-available nitrogen in cultivated systems is nitrate. Nitrate, however, can also leach through the soil and into shallow groundwater, creating environmental issues. North Carolina State University soil scientists have documented that some fertilizer and soil nitrogen can be lost from the root zone to the atmosphere through a process called denitrification. This process is the breakdown of nitrate (NO3-) to forms of gaseous nitrogen, either nitrogen gas (N2) or nitrous oxide (N2O).
Nitrogen applications to high-water-table soils of the lower coastal plain that are poorly drained and rich in organic matter are the least likely to contribute to contamination of groundwater by nitrate (Figure 2). The organic matter in the shallow groundwater provides energy for microorganisms that promote denitrification and thus much of the nitrogen is lost in the gaseous form rather than as nitrate. Therefore, nitrate leaching losses are very low (approximately 1 part per million) in these soil types.
Studies have measured nitrate levels of 10 to 15 parts per million on moderately to well-drained coastal plain soils with low organic matter where little denitrification occurs (Figure 2) (King et al. 2015; Johnson et al. 2012). Loss of nitrogen as a gas by this process is not extensive in these well-aerated, cultivated soils.
The lack of nitrate below 13 feet is explained by the presence of an almost impermeable horizon (soil layer) between the 9- and 12-foot depths. These confining beds or layers are very common in the upper and middle coastal plain. Groundwater above these depths is referred to as shallow groundwater, whereas the water below these depths is considered deep groundwater. Nitrate flows laterally along with shallow groundwater once the water hits the impermeable layer; that nitrate can resurface and enter surface waters. Many years of research at NC State have demonstrated that denitrification often removes between 25 and 50 percent of the nitrate from groundwater moving through buffered streams or wetlands (Johnson et al. 2012; Jacobs and Gilliam 1985; King et al. 2015; Messer et al. 2011; Smith 2006) (see AG-439-38, Agricultural Riparian Buffers). These same removal processes have been observed throughout the world.
Piedmont soils differ due to the increase in clay and limited nitrate leaching into shallow groundwater. Figure 3 and Figure 4 show very low losses of nitrate via leaching, presumably due to denitrification.
Part of the nitrogen from urea fertilizers can also be lost to the atmosphere by volatilization of gas ammonia (NH3). Ammonia is an intermediary nitrogen compound formed mainly during the first week after urea application. Surface application, high temperatures, low soil moisture, and high pH can promote losses up to 30 percent of applied urea and 15 percent of urea-ammonium-nitrate (UAN). Incorporation of urea fertilizers into the soil and some rainfall after application are enough to reduce the losses by ammonia volatilization to roughly zero.
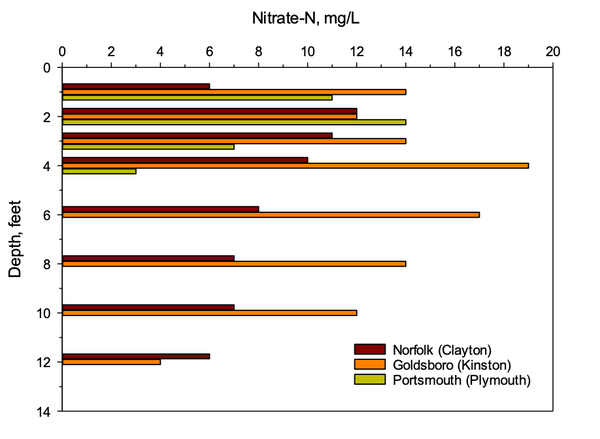
Figure 2. Nitrate-nitrogen concentrations in agricultural fields in North Carolina with depth.
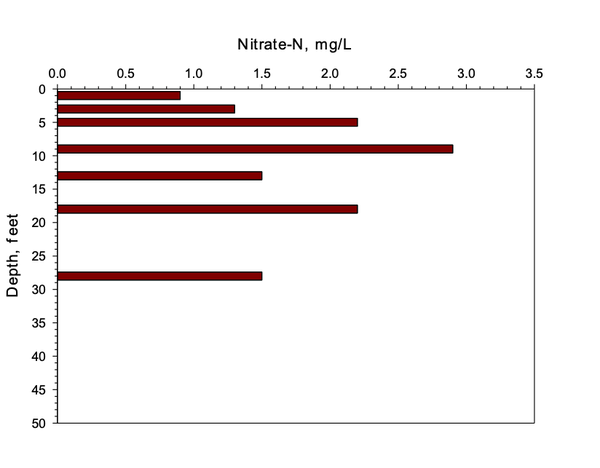
Figure 3. Groundwater nitrate concentration in an old cultivated Vance soil profile at the Oxford, NC Research Station.
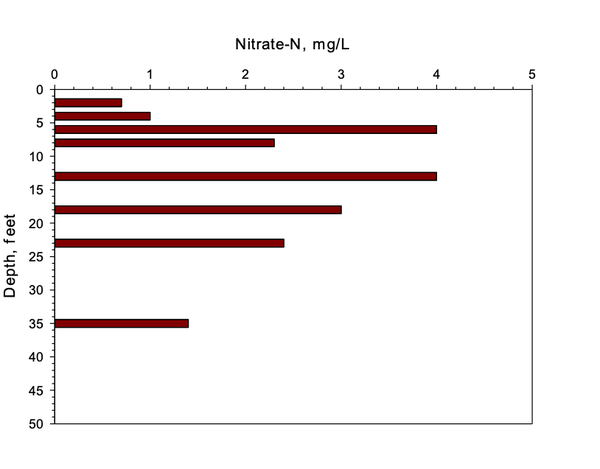
Figure 4. Groundwater nitrate concentration in an old cultivated Appling soil profile at the Upper Piedmont Research Station, Reidsville, NC.
Fertilizer Nitrogen Removed from the Soil in Surface and Subsurface Drainage
Nitrogen from fertilizers may enter streams through surface or subsurface drainage (leaching). Considerable loss of nitrogen may occur if heavy rains immediately follow a surface application of fertilizer on a moist soil surface, particularly in the sloping soils of the piedmont and mountains. However, fertilizer nitrogen in surface runoff will be low if the fertilizer is mixed with the soil or there is little slope. The loss of organic nitrogen (contained in crop residues, animal waste, or soil material) could be considerable if intense rainfall results in substantial soil and debris movement. Because it has a high solubility, nitrate normally moves with rainfall. Thus, if fertilizer nitrogen is a source of pollution, it is typically from leaching or subsurface drainage.
Leaching has been studied within and slightly below the root zone, and most studies indicate between 5 and 25 pounds of nitrogen are lost per acre per year in North Carolina cropland. Other studies monitoring surface losses suggest that approximately 2 to 10 pounds per acre are lost annually (Johnson et al. 2012; Jacobs and Gilliam 1985; King et al. 2015; Messer et al. 2001; Smith 2006). Because nitrogen either does not accumulate in the soil or accumulates very slowly, excess nitrate is either incorporated into the soil organic matter or is lost to the air or water.
Management of Nitrogen to Uphold Water Quality
Because nitrate in groundwater and surface water is a potential health hazard and contributes to eutrophication, nitrogen fertilizer must be applied carefully to crops. A commonly used framework to manage nutrients is referred to as the 4Rs (Right rate, Right timing, Right source, and Right placement). This framework is used to manage nutrients in a way that optimizes both crop production and environmental stewardship. Consistent use of the 4Rs can minimize excess nitrogen loss from agricultural fields into surface water and groundwater supplies.
- Right Rate:
- Because a soil test is not a reliable means of determining nitrogen application rates, use the North Carolina Realistic Yield Expectations (RYE) database to determine the appropriate nitrogen fertilizer application rate for your crop and soil combination.
- Because leguminous crops, including soybeans, peanuts, and alfalfa, make their own nitrogen, be sure to reduce the nitrogen rate applied to the subsequent crops based on legume nitrogen contributions. A strong alfalfa stand may provide 80 to 100 pounds of nitrogen per acre for the next crop. Soybeans, however, will provide only 15 to 30 pounds of nitrogen per acre. Once you determine the RYE nitrogen rate, simply subtract the amount of nitrogen provided by the legume to calculate the appropriate rate.
- For some crops, such as wheat or corn, use leaf tissue samples to help make nitrogen rate decisions.
- Right Timing: Split-applying nitrogen can increase NUE. For example, adding approximately one third of nitrogen at planting and the remainder later will better protect nitrogen so that it is used most efficiently by the crop. Proper timing ensures maximum daily nitrogen uptake and minimizes the likelihood of unused nitrogen leaching below the plant roots. If organic sources are used, apply them no earlier than 30 days before the crop is planted and wait 30 days after the crop is planted to resume application.
- Right Source: If organic sources of nitrogen are being used, such as animal waste, sample the material for nitrogen content and apply accordingly. Guard against overapplication before planting because this practice may contaminate water with excess nitrate nitrogen just before the crop enters a period of rapid growth. Many sources of nitrogen fertilizers are available to farmers. Each one has its own efficiency and is recommended for specific situations.
- Right Placement: The type of fertilizer or organic material, cropping system, and tillage determines the placement. In general, surface-applied fertilizers are more susceptible to runoff or gas losses, while fertilizer incorporated into the soil is generally more efficient. Due to the distinct behavior and different formulations of nitrogen sources, we highly recommend that you consult a North Carolina Cooperative Extension agent to determine the best placement method for each situation.
Nitrogen is a nutrient that is required in higher quantities than other nutrients by crop plants, but at the same time it can be detrimental to water quality when managed poorly. It is essential to use the Best Management Practices recommended by crop and soil scientists (see AG-439-20, Best Management Practices for Agricultural Nutrients). If you follow technical recommendations, it is possible to achieve the highest profitability without contributing to environmental problems.
References
Cahill, S. L., D. L. Osmond, C. R. Crozier, R. Weisz, and D. W. Israel. 2007. “Winter Wheat and Maize Response to Urea Ammonium Nitrate and a New Urea Formaldehyde Polymer Fertilizer.” Agronomy Journal 99, no. 6 (November): 1645-1653.
Cahill, S. L., D. L. Osmond, R. Weisz and R. Heiniger. 2010. “Evaluation of Nutrient Efficiency and Yield in Corn and Wheat.” Agronomy Journal 102: 1226-1236.
Cahill, S. L., D. L. Osmond, and D. W. Israel. 2010a. “Nitrogen Release from Coated Urea Fertilizers in Different Soils.” Communications in Soil Science and Plant Analysis 41, no. 10 (May): 1-12.
Jacobs, T. C. and J. W. Gilliam. 1985. “Riparian Losses of NO3-N from Agricultural Drainage Waters.” Journal of Environmental Quality 14, no. 4 (October): 472-478.
Johnson, S., M. R. Burchell, R. O. Evans, D. L. Osmond, and J. W. Gilliam. 2012. “Riparian Buffer Located in an Upland Landscape Position Does Not Enhance Nitrate-nitrogen Removal.” Ecological Engineering 52 (March): 252-261.
King, S. E., D. L. Osmond, J. Smith, M. Dukes, R. O. Evans, S. Knies, S. Kunickis, M. Burchell, and J. W. Gilliam. 2015. “Effects of Riparian Buffer Vegetation and Width: A 12-year Retrospective Study.” Journal of Environmental Quality 45, no. 4 (July): 1243-1251. doi:10.2134/jeq2015.06.0321.
Messer, T. L., M. R. Burchell, G. G. Grabow, and D. L. Osmond. 2011. “Groundwater Nitrate Reductions Within Upstream and Downstream Sections of a Riparian Buffer.” Ecological Engineering 47 (October): 297-307.
Osmond, D. L., L. Xu, N. N. Ranells, S. C. Hodges, R. Hansard, and S. H. Pratt. 2001. “Nitrogen Loss Estimation Worksheet (NLEW): Agricultural Nitrogen Loading Reduction Tracking Tool.” In Optimizing Nitrogen Management in Food and Energy Production and Environmental Protection: Contributed Papers from the 2nd International Nitrogen Conference, Potomac, MD, USA, 14-18 October 2001, edited by J. Galloway, E. Cowling, J. Erisman, J. Wisniewski, and C. Jordan, 777-783. Potomac, MD: CRC Press.
Osmond, D. L. S. L. Cahill, J. R. Schultheis, G. J. Holmes, and W. R. Jester. 2011. “Pickling Cucumber Production.” International Journal of Vegetable Science 17: 1-13.
Rajkovich, S. R., D. L. Osmond, R. Weisz, C. Crozier, D. Israel. 2017. “Evaluation of Nitrogen-Loss Prevention Amendments in Maize and Wheat in North Carolina.” Agronomy Journal 109, no. 5 (September): 1-14. doi.10.2134/agronj2016.03.0153.
Rajkovich, S., D. Osmond, R. Weisz, C. Crozier. 2017a. “Evaluation of Environmentally Smart Nitrogen for Use in Winter Wheat in North Carolina.” Crop, Forage & Turfgrass Management 3, no. 1 (January): 2016-0017. doi:10.2134/cftm2016-0017.
Smith, T. A., D. L. Osmond, and J. W. Gilliam. 2006. “Riparian Buffer Width and Nitrate Removal in a Lagoon-Effluent Irrigated Agricultural Area.” Journal of Soil and Water Conservation 61, no. 5 (September/October): 273-281.
Publication date: Oct. 31, 2019
AG-439-02
N.C. Cooperative Extension prohibits discrimination and harassment regardless of age, color, disability, family and marital status, gender identity, national origin, political beliefs, race, religion, sex (including pregnancy), sexual orientation and veteran status.