
Nitrogen (N) is rapidly cycled through the soil and has multiple forms that alter both plant availability and yield potential. Environmental losses from processes such as leaching and volatilization, as well as immobilization from soil organisms, limit the ability of soil tests to accurately predict N fertilizer needs. It is more common to estimate N fertilizer based on the plant requirements and a yield expectation. To provide better N fertilizer recommendations, NC State University faculty in 1993 created the Realistic Yield Expectation (RYE) database with assistance from the North Carolina Department of Agriculture & Consumer Services (NCDA&CS), the North Carolina Division of Environmental Quality (NC DEQ, now the Division of Water Resources), and the United States Department of Agriculture Natural Resources Conservation Service (NRCS). By 1995, the developers had created a working RYE database. The agencies originally involved in the RYE project became known as the North Carolina Interagency Nutrient Management Committee (INMC), and the committee remains active in the review and revision of the database. Voting members are appointed internally from each agency. INMC holds bimonthly meetings to discuss nutrient management issues from across the state and within the purview of Senate Bill 972 (.002 rules).
The RYE database provides four components: realistic yield expectations that represent the upper 10% of the growers’ best three out of five years of yield (nonirrigated crops only), nitrogen factor (pounds of nitrogen per unit crop yield), RYE nitrogen rate (RYE * N factor) by soil series, and phosphorus removal estimated by soil series. These data cover 32 agronomic cropping systems and all 465 agricultural soil types in North Carolina.
Original Database
To develop the current RYE database, the original RYE database was vetted through every county in North Carolina; this process occurred in 1997 and 1998. At county meetings, participants (farmers, extension agents, soil and water and NRCS personnel, regional agronomists, and faculty from NC State University) discussed the yields for each soil type and crop, providing refined data for the realistic yields, again defined as the upper 10% of growers’ yields for the best three out of five years. A small group consisting of university, NCDA&CS, and NRCS personnel further analyzed the data by crop and soil type and refined it so that there was a unique yield for each soil series and crop combination regardless of county. Nitrogen factors were then prescribed based on soil management groups. The groups were developed using information provided within county-level Soil Conservation Service (now NRCS) Soil Surveys. Each soil series was categorized into one of 61 soil management groups based on particular properties, such as physiographic region, drainage, parent material, and landscape position. The greater the yield potential of a soil, the lower the N factor. A range of N factors was set by crop. For instance, the N factors for corn ranged between 1.0 and 1.25 lbs N/bushel. The database was then synthesized into a relational database to provide N fertilizer recommended rates based on county, soil mapping units, and type of crop (Realistic Yield Expectations for North Carolina Soils). A final database was completed in 2000.
In 2013, the original RYE database was updated for corn (Rajkovitch et al. 2015) to reflect newly developed cultivars with statistically higher yields. In 2020, the RYE database was updated for wheat and again for corn (Rajkovitch et al. 2017; Austin et al. 2019) based on new experimental data. Details of the updates follow.
Revised Database - Corn (2013)
Due to progress in corn hybrid development and crop management, yields have been increasing across the United States and around the world. To ensure that the RYE database and N recommendations were current, NC State University faculty (Rajkovich et al. 2015) reviewed 80 N rate trials on corn from a 10-year period (2001 to 2011).
Experiments were set up as randomized complete block designs with generally four replications. Often four to six N rates were tested, but sometimes other factors such as spacing, fertilizer types, timing, and placement were also considered. Irrigated experiments were excluded, as the RYE database assumes rain-fed conditions. Experiments with no yield response were also excluded, generally due to unrepresentative yields from the extreme drought conditions. Thus, a total of 46 experiments were included in the 2013 update. The experiments include 16 Soil Management Groups (SMGs): 10 in the coastal plain and three each in the piedmont and mountains. Locations are shown in Figure 1.
Yield response equations were developed for each experiment and used to determine the agronomic optimum yield. In most experiments, a linear-plateau response model provided the best fit and a statistically supported yield plateau. The linear-plateau model largely results in the most conservative estimates and as such is agreed upon by the INMC when determining the optimum yield and N rate to achieve a realistic yield. Figure 2 shows examples of statistically based, best-fit linear-plateau models.
Table 1 lists the Soil Management Group descriptions and mean linear-plateau N response parameters for the experiments included in the 2013 RYE database update.
|
SMG |
Description |
Trials |
Y Intercept |
Slope |
|
Coastal Plain |
||||
|
2 |
16-51” organic layer over sands, vpd |
3 |
94 |
0.46 |
|
3 |
16-51” organic layer over silts, loams, vpd |
1 |
117 |
0.63 |
|
6 |
Min-org histic or umbric, fine or silty, vpd |
8 |
76 |
0.38 |
|
7 |
Min-org. histic or umbric, loamy, vpd |
13 |
84 |
0.48 |
|
10 |
Mineral, silty, pd |
4 |
81 |
0.48 |
|
11 |
Mineral, fine, pd |
1 |
52 |
0.78 |
|
12 |
Mineral, fine loamy & coarse loamy, pd |
3 |
91 |
0.51 |
|
20 |
Mineral, fine loamy & coarse loamy, mwd |
1 |
84 |
0.69 |
|
25 |
Mineral, fine loamy & coarse loamy, wd |
2 |
85 |
0.28 |
|
27 |
Arenic, 20-40” to Bt, loamy, wd to ewd |
1 |
50 |
0.39 |
|
Piedmont |
||||
|
109 |
Rhodic, fine, wd |
1 |
25 |
1.14 |
|
111 |
Felsic, fine, wd |
1 |
65 |
0.28 |
|
113 |
Slate belt, fine, wd |
2 |
82 |
0.38 |
|
Mountain |
||||
|
205 |
Flood plains, loamy, swpd to wd |
3 |
230 |
0.48 |
|
206 |
Terrace-toe slope, fine loamy, mwd to wd |
1 |
126 |
0.64 |
|
215 |
Terrace, argillic horizon, fine loamy, wd |
1 |
119 |
0.40 |
|
Drainage class: |
||||
Based on the new yield response curves, optimum N rates and N factors were determined (Table 2). The new values (Mea.) were compared to the current information (Std.) in the RYE database and summarized for each physiographic region: coastal plain, piedmont, and mountains.
|
SMG |
N |
Optimum Yield |
Optimum N Rate |
N Factor |
||||||
|
Std. |
Mea. |
SD1 |
Std.2 |
Mea. |
SD |
Std. |
Mea.3 |
SD |
||
|
bu/ac |
lb/ac |
lb N/bu |
||||||||
|
Coastal Plain |
||||||||||
|
2 |
3 |
130 |
161 |
29 |
116 |
120 |
22 |
1.06 |
0.89 |
0.10 |
|
3 |
1 |
150 |
181 |
– |
137 |
81 |
– |
1.06 |
0.57 |
– |
|
6 |
8 |
146 |
150 |
21 |
139 |
164 |
47 |
1.06 |
1.21 |
0.28 |
|
7 |
13 |
135 |
162 |
32 |
135 |
138 |
36 |
1.11 |
0.97 |
0.28 |
|
10 |
4 |
138 |
167 |
36 |
124 |
143 |
39 |
1.06 |
0.99 |
0.12 |
|
11 |
1 |
120 |
183 |
– |
130 |
134 |
– |
1.08 |
0.73 |
– |
|
12 |
3 |
130 |
149 |
57 |
118 |
96 |
26 |
1.08 |
0.91 |
0.53 |
|
20 |
1 |
130 |
149 |
– |
126 |
75 |
– |
1.14 |
0.65 |
– |
|
25 |
2 |
115 |
128 |
72 |
105 |
134 |
48 |
1.14 |
1.34 |
0.34 |
|
27 |
1 |
75 |
114 |
– |
70 |
130 |
– |
1.22 |
1.33 |
– |
|
Mean |
37 |
134 |
157* |
33 |
128 |
136 |
40 |
1.09 |
1.02 |
0.31 |
|
Piedmont |
||||||||||
|
109 |
1 |
132 |
201 |
– |
125 |
123 |
– |
1.11 |
0.72 |
– |
|
111 |
1 |
119 |
111 |
– |
132 |
130 |
– |
1.11 |
1.17 |
– |
|
113 |
2 |
114 |
136 |
6 |
101 |
126 |
57 |
1.08 |
1.08 |
0.37 |
|
Mean |
4 |
120 |
146 |
39 |
115 |
126 |
33 |
1.10 |
1.01 |
0.29 |
|
Mountains |
||||||||||
|
205 |
3 |
155 |
272 |
11 |
142 |
86 |
40 |
1.06 |
0.40 |
0.14 |
|
206 |
1 |
172 |
191 |
– |
177 |
80 |
– |
1.03 |
0.42 |
– |
|
215 |
1 |
201 |
209 |
– |
223 |
180 |
– |
1.11 |
0.86 |
– |
|
Mean |
5 |
168 |
243* |
41 |
165 |
104 |
51 |
1.06 |
0.49* |
0.23 |
|
1 Standard deviation of the mean for measured values in the field experiments. |
||||||||||
In the review of the 2013 data, optimum N rates from the experimental data agreed well with RYE recommended N rates. However, yields increased by 15%, 18%, and 31%, respectively, for the coastal plain, piedmont, and mountain regions. Based on these findings, the INMC voted to increase yields by 20% for all soils except floodplain soils in the mountains. Expected yields in mountain soils were increased to 250 bu/ac, N fertilizer rates were left unchanged, and N factors were adjusted accordingly. Since optimum N rates were stable in all other soils, N factors were determined for each soil series by dividing the current N rate by the revised yield. Consequently, the N factor became a function of the individual soil series and was no longer solely based on the soil management group. The INMC also reviewed the experiments by tillage. It is frequently suggested by various groups that long-term conservation tillage requires less N. Our data did not support this contention (Table 3).
|
Tillage |
N |
Optimum Yield |
Optimum N Rate |
N Factor |
||||||
|
Std. |
Mea. |
SD1 |
Std.2 |
Mea. |
SD |
Std. |
Mea.3 |
SD |
||
|
bu/ac |
lb N/ac |
lb N/bu |
||||||||
|
Conventional |
21 |
141 |
172 |
52 |
137 |
134 |
53 |
1.09 |
0.96 |
0.42 |
|
No-till<10 yr |
18 |
132 |
152 |
37 |
125 |
127 |
28 |
1.08 |
1.00 |
0.27 |
|
No-till>10 yr |
7 |
135 |
177* |
20 |
127 |
135 |
37 |
1.08 |
0.86* |
0.13 |
|
1 Standard deviation of the mean for measured values in the field experiments. |
||||||||||
Corn is often preceded by soybeans or peanuts in rotation, which can provide additional N. Based on the experimental data and analysis of N fertilizer rates relative to the prior crop, the INMC decided that a credit for soybeans (15 to 30 lb N/ac/yr) and peanuts (20 to 40 lb N/ac/yr) is justifiable and will be continued (Table 4).
|
Previous Crop |
N |
Optimum Yield |
Optimum N Rate |
N Factor |
||||||
|
Std. |
Mea. |
SD1 |
Std.2 |
Mea. |
SD |
Std. |
Mea.3 |
SD |
||
|
bu/ac |
lb N/ac |
lb N/bu |
||||||||
|
Corn |
5 |
132 |
146 |
23 |
144 |
167 |
58 |
1.09 |
1.15 |
0.34 |
|
Cotton |
1 |
135 |
120 |
– |
150 |
120 |
– |
1.11 |
1.24 |
– |
|
Fallow |
2 |
186 |
200 |
13 |
200 |
130 |
71 |
1.07 |
0.64 |
0.31 |
|
Peanut |
1 |
115 |
179 |
– |
101 |
168 |
– |
1.14 |
1.11 |
– |
|
Potato |
1 |
135 |
150 |
– |
150 |
105 |
– |
1.11 |
0.70 |
– |
|
Soybean |
35 |
135 |
167* |
46 |
125 |
126 |
38 |
1.09 |
0.95* |
0.34 |
|
Wheat |
1 |
120 |
183 |
– |
130 |
134 |
– |
1.08 |
0.73 |
– |
|
1 Standard deviation of the mean for measured values in the field experiments. |
||||||||||
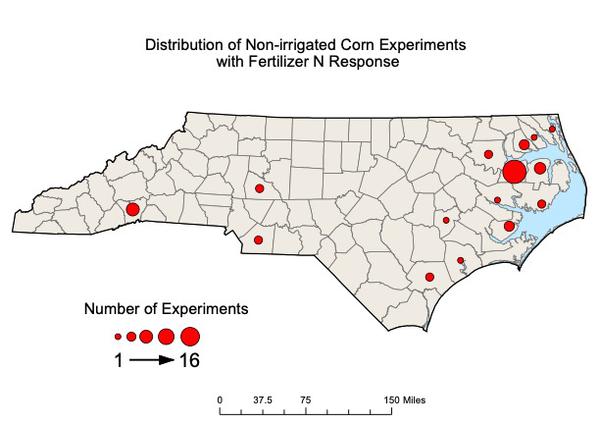
Figure 1. Location and number of nitrogen rate experiments included in the 2013 RYE database update for corn.
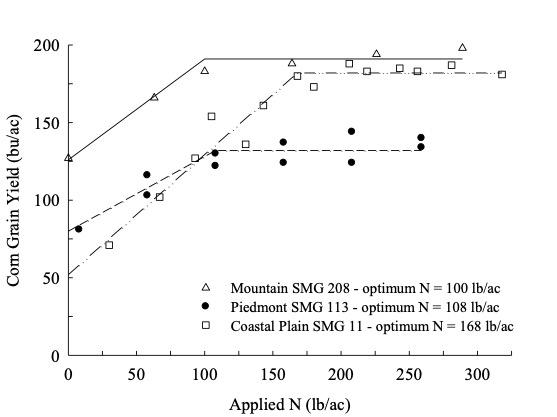
Figure 2. Linear-plateau response model for a coastal plain, piedmont, and mountain soil.
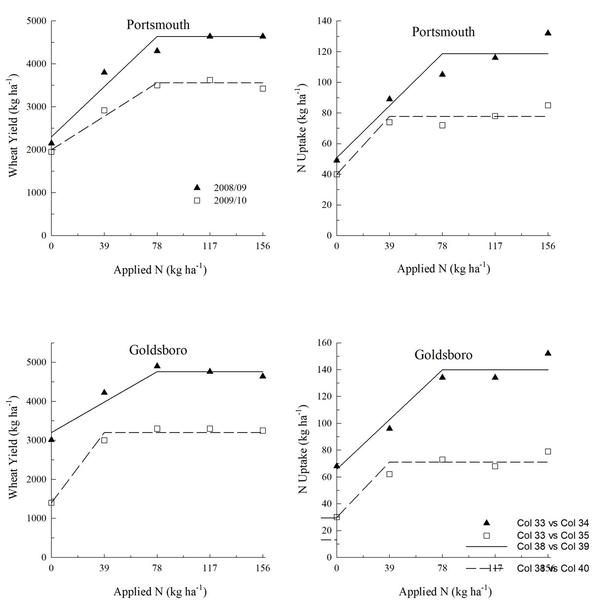
Figure 3. Optimum wheat yields and nitrogen.
Canon Engoke, Carl Crozier, and Jot Smyth. Personal communication
Revised Database (2020)
Yield and N rates were reevaluated for corn and wheat at the end of 2019. Experimental data were derived from Engoke et al. 2013; Rajkovich et al. 2017; and Austin et al. 2019. Two of these experiments were conducted on research farms where optimum yield and N rates were determined with linear-plateau equations, while the Austin et al. 2019 data were derived from a five-year farmer N network trial in the coastal plain (170 site-years). Based on data from these sources and on detailed discussions surrounding additional nonpublished research data (OVT trials, Moody thesis, and yield trends in the USDA NASS data), the INMC agreed that N rates were appropriate for both corn and wheat; however, a yield increase in the RYE database is justified. Following is a summary of the discussions from the September 2019 INMC meeting. Based on these discussions, David Crouse was asked to develop updated RYE numbers and N factors for the INMC committee to review and finalize in January 2020.
Wheat: Research by Rakovich et al. 2017 was presented (four site-years, wheat), but only two locations met the linear-plateau standard. Data from the Johns soil demonstrated that wheat yields increased 60 bu/ac, while on Portsmouth soils wheat yield increased 70 bu/ac. However, these data were not included in the analysis because a plateau was never reached. Lloyd soil (two years of data) wheat yields increased 50 bu/ac over RYE yield in 2014 and 2015. Data from Engoke et al. 2013 (Figure 3) demonstrated in 2008 and 2009 that wheat yield increased 30 and 60 bu/ac on a Plymouth soil, while wheat yield increased 55 and 15 bu/ac on a Goldsboro soil over RYE.
With 70 site-years of data from the five-year N rate trial (2013 to 2017), Austin et al. 2019 showed an average yield increase of 15 bu/ac over the RYE expected yield. Finally, the average yield for wheat from the North Carolina Official Variety Testing (OVT) is 84 bu/ac, 37 bushels more than the state average. Summarizing these data sources, and with measured yields from the linear-plateau models, an average yield increase of 45 bu/ac for wheat was proposed and adopted.
Corn: Rajkovich et al. 2017 provided six site-years of corn. Optimum N rates were similar or lower than RYE N rates. Lynchburg soil corn yield increased 50 bu/ac, while Portsmouth soil corn yields increased 25 bu/ac. The Lloyd soil had an increase of 25 bu/ac in 2014; however, in 2015, the yield difference was -60 bu/ac (drought year). On the Comus soil, corn yields and RYE were the same, while the Codorus soil yield increase was 80 bu/ac greater than RYE. Variety trial data (previous five years) and 100 site-years of data from our on-farm N rate study (2013 to 2017) (Austin et al. 2019) demonstrated that corn was on average 30 bu/ac greater than RYE. For corn, yield increases averaged about 2 bu/ac/yr based on genetics and crop management improvements alone (NASS, OVT). More than 10 years have passed since the last update to the RYE database, which corresponds to a 20 bu/ac increase. The average yield increase using the linear-plateau models and aforementioned data sources suggested an increase of 30 bu/ac for corn. Since yields for wheat were increased by 45 bu/ac and corn by 30 bu/ac but the N rates were considered sufficient to achieve the new yields, the N factors were adjusted downward, resulting in an increase in the N efficiency by these crops. It is generally accepted that recent improvements in efficiency are due to a combination of improved plant genetics and better crop and fertilizer management.
The INMC will continue to revise and update information in the RYE database to reflect changes in North Carolina agriculture, offering an actualized, data driven, and adaptive approach to predict the nitrogen requirement for the main crops used in this state.
Acknowledgments
Thanks to the Corn Growers Association of North Carolina, the North Carolina Small Grain Growers Association, NC State University, and many groups for sponsoring the research that allowed us to develop this fact sheet. Thanks also to the members of the North Carolina Interagency Nutrient Management Committee who provided thoughtful discussion regarding changes to the RYE database.
References
Austin, R., D. Osmond, and S. Shelton. 2019. “Optimum nitrogen rates for maize and wheat in North Carolina.” Agronomy Journal 111, no. 5 (January): 2558-2568. https://doi.org/10.2134/agronj2019.04.0286
Engoke, C.N.S. 2013. Verification of Poultry Manure Nitrogen Availability and Fertilizer Nitrogen Equivalence Coefficients for Crop Production in North Carolina Soils. Doctor of Philosophy Dissertation. North Carolina State University. http://www.lib.ncsu.edu/resolver/1840.16/8351
Rajkovich, S., C. Crozier, J. Smyth, D. Crouse, and D. Osmond. 2015. “Updating North Carolina corn yields and N recommendations to match current production practices, including new varieties.” Crop, Forage, and Turfgrass Management 1:1-8. https://doi.org/10.2134/cftm2014.0085
Rajkovich, S. R., D. L. Osmond, R. Weisz, C. Crozier, and D. Israel. 2017. “Evaluation of nitrogen-loss prevention amendments in maize and wheat in North Carolina.” Agronomy Journal 109, no. 5 (September): 1-14. https://doi.org/10.2134/agronj2016.03.0153
Publication date: April 21, 2020
AG-878
N.C. Cooperative Extension prohibits discrimination and harassment regardless of age, color, disability, family and marital status, gender identity, national origin, political beliefs, race, religion, sex (including pregnancy), sexual orientation and veteran status.