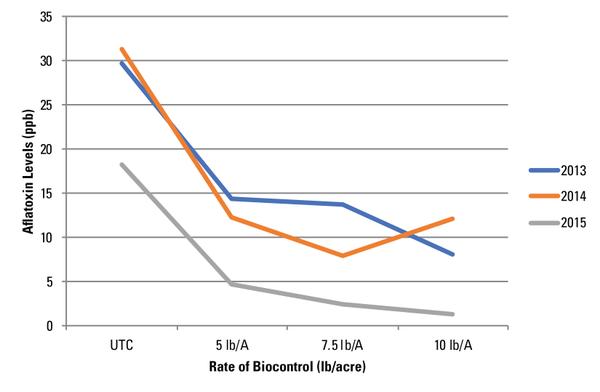
Figure 6. AF concentrations (ppb) in response to biocontrol application rate (lb/acre). In each of the three years, the zero-application rate was significantly higher (P < 0.05) than the other three rates.