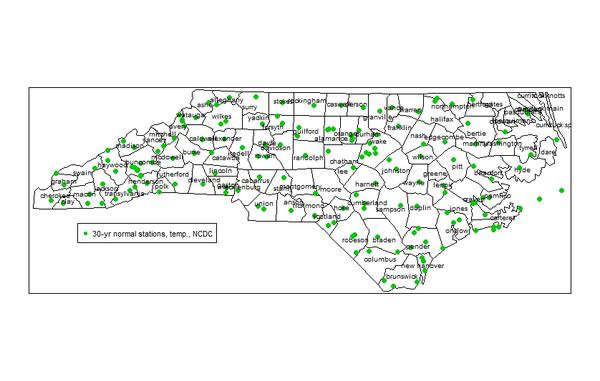
Figure 2. Thirty-year normal temperature stations.
Map of NC with dots at each normal temperature station