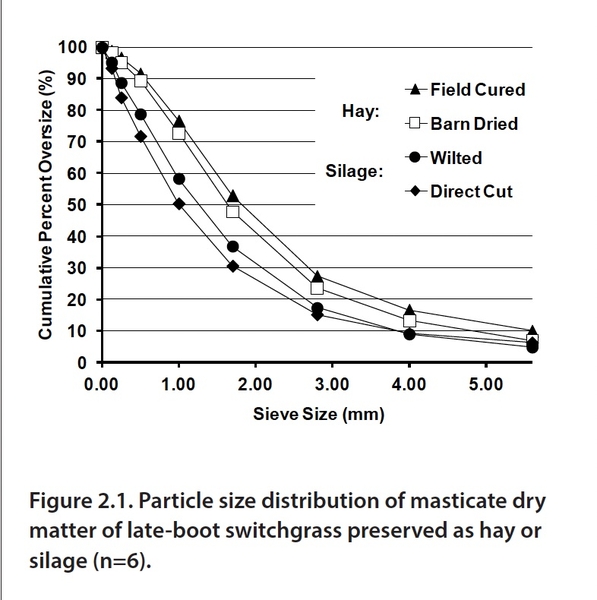
Figure 2.1. Particle size distribution of masticate dry matter of late-boot switchgrass preserved as hay or silage (n=6).