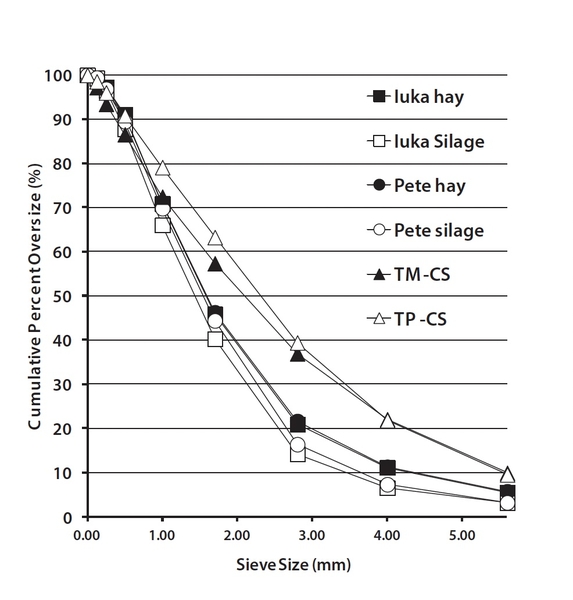
Figure 8.1. Particle size distribution of masticate dry matter for Iuka and Pete gamagrass preserved as hay and silage, and for temperate corn silage (TM-CS) and tropical corn silage (TP-CS), Experiment 8D (n = 4 for gamagrass; n = 6 for corn silage).