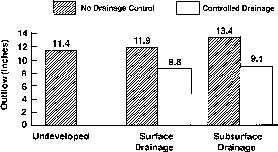
Figure 10a. Average annual outflows measured from 14 sites in eastern North Carolina. The values shown represent approximately 125 site-years of data (Evans et al., 1991).