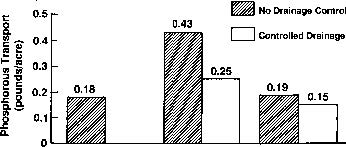
Figure 10c. Average annual total phosphorus transport in drainage outflow as measured at the field edge for 12 soils and sites. Values shown are for mineral soils only. Two sites with organic soils were not included (Evans et al., 1991).