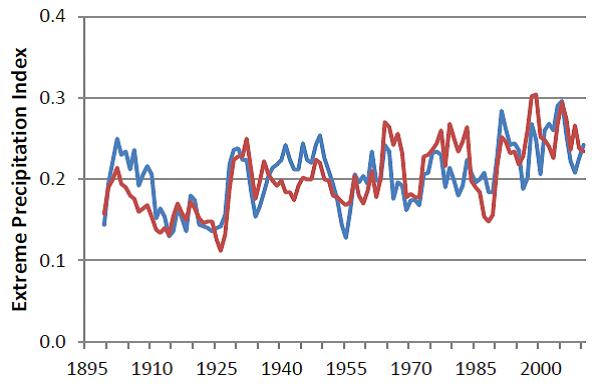
Figure 7. Increasing occurrence of extreme precipitation events over the past century from the National Climatic Data Center. Blue represents long-duration extreme events. Red represents short-duration extreme events.

Image from Draft: Southeast Region Technical Report to the National Climate Assessment