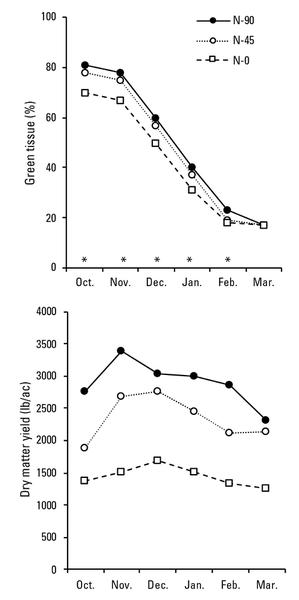
Figure 5. Changes in dry matter accumulation and in the proportion of green tissue due to N fertilization rates. Nitrogen rates were 0, 45, and 90 lb/ac. Data are averages of three years. Adapted from Taylor and Templeton (1976).