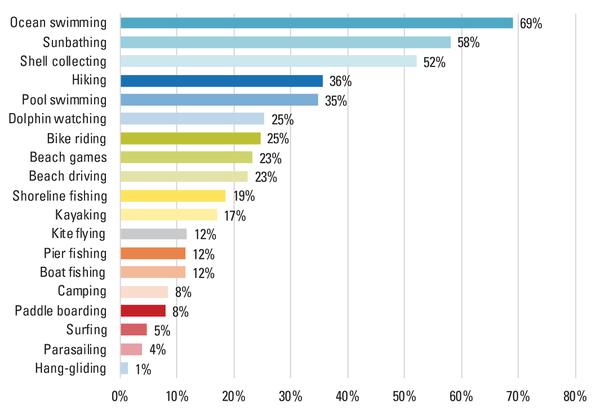
Figure 7. Participation in specific activities on the OBX (% of respondents).
Bar chart with percentages for different activities like swimming, kayaking, fishing, etc