
Departments of Soil Science and Biological and Agricultural Engineering
North Carolina Agricultural Research Service
North Carolina State University
Raleigh, North Carolina
Technical Bulletin 318
September 2002
This publication should be cited as follows:
Osmond, D.L. 2023. Riparian Buffers and Controlled Drainage to Reduce Agricultural Nonpoint Source Pollution, North Carolina Agricultural Research Service Technical Bulletin 318, North Carolina State University, Raleigh, NC.
Funding for printing and layout of the original 2002 PDF version was provided by the Center for Agricultural Partnerships through grants from Pew Charitable Trust Foundation and USEPA.
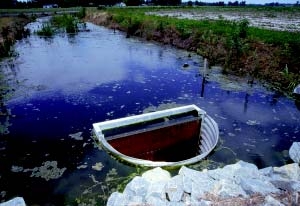
Table of Contents
- INTRODUCTION
- RIPARIAN BUFFERS: WHAT ARE THEY and HOW DO THEY WORK?
- Introduction
- Definition
- What Do They Do and How Do They Work?: Introduction
- What Do They Do and How Do They Work?: Buffer Design
- What Do They Do and How Do They Work?: Protect Stream Health
- What Do They Do and How Do They Work?: Reduce Nitrogen
- What Do They Do and How Do They Work?: Reduce Sediment, Phosphorus, and Pesticide
- CONTROLLED DRAINAGE: WHAT IS IT and HOW DOES IT WORK?
- STREAM MODIFICATIONS
- PHYSIOGRAPHIC REGIONS AND RECOMMENDED BMPS
- Decision Tree for Determining BMP Usage
- Mountains
- Recommended Practices in the Mountains to Control Nonpoint Source Pollution
- GLOSSARY
- REFERENCES
LIST OF FIGURES
Figure 1. Typical hydrologic cycle for eastern North Carolina
Figure 2. Schematic of the two-zone riparian forest buffer system
Figure 3. Stream order designations
Figure 4. Conceptual model of below-ground processes affecting ground water nutrients in riparian forest
Figure 5. Nitrate concentrations in groundwater beneath riparian forests
Figure 6a. Groundwater flow paths most conducive to denitrification
Figure 6b. Groundwater flow paths less conducive to denitrification
Figure 6c. Groundwater flow paths sometimes conducive and sometimes not conducive to denitrification
Figure 7. Buffer width and phosphorus retention effectiveness
Figure 8. Surface drainage system
Figure 9a. Controlled drainage showing flashboard riser
Figure 9b. Water profile in drainage ditch upstream of flashboard riser
Figure 10a. Average annual outflows measured from 14 sites in eastern North Carolina. The values shown represent approximately125 site-years of data
Figure 10b. Average annual nitrogen transport (TKN and NO3-N) in drainage outflow as measured at the field edge for 14 soils and sites
Figure 10c. Average annual total phosphorus transport in drainage outflow as measured at the field edge for 12 soils and sites. Values shown are for mineral soils only. Two sites with organic soils were not included
Figure 11. Water table depth in relationship to stream location
Figure 12. Controlled drainage
Figure 13. Landscape Middle Coastal Plain
Figure 14. Relationship between landscape position, water table depth, and soil series in the Middle Coastal Plan
Figure 15. Relationship between soil and saprolite
Figure 16. Shrub buffer
Figure 17. Depth of groundwater for effective nitrate control
Figure 18. Mineralogy from Chapel Hill to Raleigh
Figure 19. Recommended riparian buffer
Figure 20. Detailed cross-section of level spreader trench for dispersing runoff along the contour
Figure 21. Design of level spreader used for dispersing agricultural runoff through a forested riparian buffer
Figure 22. Pasture stream with fenced riparian buffer
Figure 23. The mountain region of North Carolina and the three regional divisions
LIST OF TABLES
Table 1. Above-ground woody vegetation uptake of nitrogen and phosphorus in Coastal Plain riparian forests
Table 2. Sediment reduction by grass riparian buffers on a Piedmont site
Table 3. Sediment reduction by grass riparian buffers on a Coastal Plain site
Table 4. Effects of different size riparian buffers on reductions of sediment and nutrients from field surface runoff
Table 5. General water table management guidelines to promote water quality and optimum crop yields for a two-year rotation of corn-wheat-soybeans
Introduction
The Problem of Water Pollution in North Carolina
North Carolina is a state with abundant water resources. There are over 35,000 miles of streams and rivers in North Carolina as well as several of the largest estuaries in the United States and 320 miles of coastal waters. The water resources in North Carolina most affected by pollution are streams and rivers followed by lakes and ponds. Only 40% of the streams and rivers are rated as fully supporting, which means the streams and rivers meet their designated uses, such as providing water for swimming, fishing, and drinking (USEPA, 1995a). Approximately 75% of the lakes and ponds and 95% of the estuaries are rated as fully supporting.
Within the boundaries of the State of North Carolina there are 17 river basins: Broad, Cape Fear, Catawba, Chowan, French Broad, Hiwassee, Little Tennessee, Lumber, New, Neuse, Pasquotank, Roanoke, Savannah, Tar-Pamlico, Watauga, White Oak, and Yadkin. In general, the water quality of the river basins located in the mountains is high to very high, while the water quality of rivers that traverse the Piedmont and Coastal Plain is of lower quality. Stream and river water quality in some of the river basins is very high (Hiwassee, Little Tennessee, Savannah, and Watauga). However, water quality in the Cape Fear, Chowan, Lumber, Neuse, and Tar-Pamlico river basins is degraded by pollution from many sources.
The types of pollution vary: sediment, nutrients (nitrogen and phosphorus), bacteria (fecal coliform), metals, organics (oil, grease, pesticides), and oxygen-reducing materials. The pollutants most common are sediment and nutrients.
The sources of pollution are diverse, although the majority of the pollutants are delivered from nonpoint sources (diffuse runoff) as opposed to point sources (e.g., wastewater treatment systems, factories). Of the nonpoint sources of pollution in the United States, the U.S. Environmental Protection Agency (USEPA, 1995a) estimates that agriculture contributes 53%, construction 10%, mining and other activities 13%, miscellaneous sources 12%, and urban runoff 12% to the pollution load.
Pollutants of Concern and Their Delivery
Sediment
Excessive sediment from eroding cropland, overgrazed pasture, construction sites, and other activities impacts water resources by reducing water resource storage; destroying fish and wildlife habitat; and negatively affecting property values, recreational uses (boating, fishing, swimming), commercial uses (drinking water supplies), and navigation (USEPA, 1989; Clark et al., 1985).
Water erosion is the natural process of soil movement from higher areas to lower areas by the action of water flowing downhill. During a storm event, precipitation rates may be greater than infiltration rates, resulting in overland flow of water or runoff. This creates the potential for water erosion. Agricultural activities, such as soil cultivation and the destruction of vegetative cover, accelerate soil erosion (Hickman et al., 1994).
Water erosion is a combination of three processes: 1) detachment, 2) transport, and 3) deposition. Soil is detached by the energy of raindrop impact or the force of flowing water. Transport of soil occurs via flowing water and soil deposition occurs when water velocity slows and suspended soil particles settle (Hickman et al., 1994). Most soil deposition occurs on land, although some soil reaches water resources, where it negatively affects uses of the water resources.
Nutrients: Nitrogen and Phosphorus
Nutrients (phosphorus or nitrogen) can enter water resources through surface runoff either dissolved in the water or attached to soil particles. Nitrogen and phosphorus can accelerate eutrophication of water resources, resulting in algal blooms, reduced transparency, undesirable shifts in algal and fish populations, and even fish kills (Clark et al., 1985). Nonpoint source nitrogen and phosphorus originate from agricultural activities, both row crop and animal operations, as well as urban stormwater runoff. Most phosphorus is delivered via overland flow into receiving water resources, usually attached to soil particles. Organic forms of nitrogen, attached to sediment or as part of organic matter, also enter surface waters through overland flow.
The majority of nonpoint source nitrogen that enters surface waters is transported through subsurface flows. Surface runoff water commonly contains low concentrations of nitrogen compared to groundwater flows from fertilized fields (or lawns). Most nitrogen added to soils as commercial fertilizer or organic wastes is converted to nitrate-nitrogen, a mobile form of nitrogen that readily moves with soil water. As rainwater enters the soil and flows downward through the rooting zone, the nitrogen will be absorbed by growing plants or it will move into the shallow groundwater aquifer. The movement of nitrogen into the groundwater most often occurs during the winter when plants are not growing, but nitrate leaching can also occur in very wet periods during the spring or summer.
Once the nitrate-nitrogen moves below the water table and enters the saturated zone, it will flow with the groundwater. In upland areas, groundwater tends to move downward, driven by periodic rainfall events that recharge the groundwater system. As the groundwater percolates downward, it frequently encounters discontinuous clay lenses, which are found throughout the Coastal Plain. These lenses, or aquitards, transmit water more slowly than the overlying sediments. Thus, once an aquitard is encountered, the major portion of the nitrate-nitrogen laden water will move laterally, discharging into a stream or ditch. However, some groundwater will flow into a semi-confined aquifer beneath the aquitard, either by transmission through the aquitard or by downward flow along the discontinuous boundaries of the lens (Figure 1). Nitrate is not normally found in aquifers lying below these confining layers. Nitrate that is carried with the groundwater eventually discharges to a surface-water body (stream, wetland, or lake). The amount of nitrate entering the surface water can be reduced if the groundwater flows through a riparian buffer or discharges into a controlled drainage system (which will be discussed later). Nitrate in groundwater that passes through a riparian buffer may either be absorbed by plant roots or converted to a harmless gas by the soil bacteria. Denitrification in riparian soils is an extremely important process for removing nitrate from groundwater flowing from fertilized fields.
High concentrations of nitrate in the groundwater are problematic. A recent North Carolina study of 1,719 drinking water wells found that 1.8% of the wells had nitrate-nitrogen levels at or above 10 mg L-1 or 10 ppm (Miner et al., 1996). The threshold for contaminated drinking water is 10 ppm nitrate-nitrogen. In infants, 10 ppm may cause Methemoglobinemia, or Blue Baby Syndrome, a condition in which nitrite binds with hemoglobin, thus reducing the transport of oxygen to tissues. Asphyxia may occur. Approximately 20% of the wells sampled contained between 4 and 9 ppm nitrate-nitrogen (Miner et al., 1996). Nitrate-nitrogen concentrations were greater in wells in Coastal Plain counties, where 4.9% of the tested wells contained 10 ppm nitrate-nitrogen or higher.
The contamination trend by nitrate-nitrogen is consistent with national survey results. A recent USEPA national well water study found that 2.4% of rural private wells contained nitrate-nitrogen concentrations above 10 mg L-1 (USEPA, 1990). In addition, nitrogen concentrations as low as 1 mg L-1 can cause problems for aquatic processes, including eutrophication and beneficial aquatic vegetation die-off (Osmond et al., 1995a).
Fecal Coliform
Fecal coliform contamination — caused by animal waste runoff, septic systems, and point discharges of water from wastewater treatment plants — may result in adverse water quality conditions. When health advisory levels for fecal coliform concentrations are exceeded, water resources are closed for body contact sport as well as harvesting of filter feeders (mussels, oysters). Currently, 18% of North Carolina’s shellfish beds are closed to harvesting due to fecal coliform contamination.
Most nonpoint sources of fecal coliform contamination are caused by overland flow. Runoff from areas of fecal deposition move into surface waters or sometimes even into drinking water wells if the wells are not constructed properly.
Pesticides
Some pesticides may enter water resources through surface runoff, either dissolved in the water or attached to soil particles. In addition, pesticides can be leached through the soil into the groundwater.
In North Carolina, Wade et al. (1997) found that 5 of 46 wells, or 12% of the drinking water wells tested, were above Maximum Contaminant Levels for the pesticides tested. Three of these pesticides are currently registered; two were formerly registered. Using groundwater data from eight states, Goodrich et al. (1991) found that pesticides had been detected in 40% of private rural or farm wells sampled. Pesticide contamination can affect biota as well as contaminating drinking water supplies (Call et al., 1984).
Solutions: Best Management Practices
Point sources of pollution were regulated through federal legislation (The Clean Water Act) in 1972. As a consequence, 60 to 80% of the pollution that now occurs in United States waters comes from nonpoint sources (USEPA, 1995a). In order to reduce the impact of nonpoint source pollution, changes in management must occur. Pollutants from nonpoint sources can be controlled through the use of best management practices.
Best management practices (BMPs) are used to protect and conserve natural resources. Some BMPs are used to protect water resources, while other BMPs are implemented to protect wildlife habitat, both terrestrial and aquatic. Still other BMPs are utilized to protect land resources from degradation by wind, salt, and toxic levels of metals.
By controlling pollutants derived from agricultural or urban sources, BMPs can reduce or prevent impacts to the physical and biological integrity of surface and groundwater and land resources.
Best management practices can be either structural (waste lagoons, terraces, sediment basins, or fencing) or managerial (rotational grazing, nutrient management, pesticide management, or conservation tillage). Both types of BMPs require good management to be effective in reducing agricultural nonpoint source pollution.
Best Management Practices: How They Work
Transport of agricultural pollutants to surface and groundwater can be reduced by BMPs. Best management practices reduce contamination by:
- minimizing availability of pollutants;
- retarding the transport and/or delivery of the pollutant, either by reducing water transported and thus the amount of the pollutant transported or through deposition of the pollutant; and
- remediating or intercepting the pollutant before or after it is delivered to the water resource through chemical or biological transformation.
Sediment
- Sediment loss can be reduced by utilizing BMPs that minimize soil particle detachment. Practices that maintain crop residues or vegetative cover and improve soil properties — such as soil structure, organic matter, and soil roughness —should be used. Conservation tillage practices are examples of BMPs that can reduce sediment loss.
- Transport of sediment can be minimized by increasing crop residue or vegetative cover, reducing slope length and steepness, and slowing the movement of water. Terraces, field borders, grassed waterways, and contour cropping are BMPs used to slow the transport of sediment.
- Best management practices that intercept sediment and cause deposition reduce sediment delivery to water resources. Sediment basins, vegetative filter strips, and forested riparian buffers are examples of BMPs that intercept sediment by slowing the water velocity so that the sediment can settle out.
Nutrients
- Nutrient management is used to reduce nutrients transported to surface and groundwater. Nutrient management includes matching nutrient application rates with crop needs, placing fertilizer correctly to optimize uptake, and timing fertilizer applications to meet the plants’ nutrient uptake capacity. For nutrients that are transported while attached to soil particles (phosphorus and some nitrogen species), BMPs that reduce sediment loss will also reduce nutrient loss.
- Best management practices that reduce the transport of nutrients include field borders, filter strips, and critical area plantings, including practices that slow runoff, such as contour farming and terraces and, in areas that are irrigated, irrigation management.
- Nutrients can be intercepted or transformed by using BMPs such as cover crops, riparian buffers, controlled drainage, or created in-stream wetlands. Cover crops may absorb residual nitrogen from deep in the soil profile, thus reducing leaching losses. Nitrate may be removed in riparian buffers through both denitrification and uptake, whereas organic nitrogen and phosphorus, attached to sediment, may be retarded by sediment deposition.
Pesticides
- Pesticides can be reduced by using crop management and integrated pest management techniques, which call for pesticides to be applied only when needed, and for the proper type pesticide to be applied at the correct rate and time.
- Transport of pesticides can be slowed by using the same type of BMPs that are employed to slow the transport of nutrients and sediment.
- Pesticides that are adsorbed to soil particles can be intercepted using riparian buffers and sediment-intercepting BMPs, such as sediment basins.
Best Management Practices: Systems
The installation or use of one structural or management BMP is rarely sufficient to control the pollutant of concern completely. Combinations of BMPs that control the same pollutant are generally more effective than individual BMPs. These combinations, or systems, of BMPs can be specifically tailored for particular agricultural and environmental conditions, as well as for a particular pollutant (Osmond et al., 1995b).
A BMP system is any combination of BMPs used together to comprehensively control a pollutant from the same source. When a pollutant originates from more than one source, a separate BMP system should be designed to reduce pollutant loss from each source. For example, if the problem is sediment from cropland, the BMP system to control field erosion would be different than if the sediment originated from cattle in the riparian buffer. To control sediment from livestock activities, fencing, revegetation of the riparian buffer, strategically located water troughs, and rotational grazing could be combined into a BMP system. The control of sediment from croplands could consist of many different techniques, including minimum tillage, strip cropping, field borders, and other practices.
An individual BMP can only control a pollutant at its source, during transport, or at the water’s edge. Systems of BMPs are generally control pollutants more effectively since they can be used at two or more points in the pollutant-delivery system. For example, in the Neuse River Basin, the current objective is to reduce the loss of nitrogen from cropland by 30%. A system of BMPs can be designed to reduce nitrogen at the source and during transport as well as to remediate the nitrogen at the water’s edge. Nutrient management should be used to minimize nitrogen additions to surface and groundwater (source reduction) but maintain yields. On average, only 40 to 60%of nitrogen fertilizer is used by crops. The remainder of the nitrogen becomes part of the soil organic matter, moves into the groundwater, denitrifies (becomes gaseous nitrogen), or runs off with surface water. Field borders can be used to slow runoff from the field, thus decreasing transport of nitrogen by increasing movement of the nitrogen and water into the soil and increasing the absorption of the nitrogen by the field border crop. Nitrogen that is not controlled by nutrient management and field borders can be intercepted and remediated by riparian buffers along the water resource. Nitrate-nitrogen associated with groundwater can be either denitrified by soil bacteria or absorbed by the riparian vegetation. Organic nitrogen, attached to soil particles flowing overland, can be trapped by the riparian vegetation. Used in conjunction as a system, these BMPs will reduce nitrogen loads into streams, rivers, lakes, and estuaries.
There is no single ideal BMP system to control a particular pollutant in all situations. Rather, the BMP system should be designed based on the:
- type, source, and cause of the pollutant;
- agricultural, climatic, and environmental conditions;
- economic situation of the farm operator;
- experience of the system designers; and
- acceptability by the producer of the BMP components.
However, even properly designed systems of BMPs constitute only part of an effective land treatment strategy. In order for a land treatment strategy to be really effective, properly designed BMP systems must be placed in the correct locations in the watershed (critical areas) and the extent of land treatment must be sufficient to achieve water quality improvements (Line and Spooner, 1995). Generally, 75% of the critical area must be treated with the appropriate BMP systems. If the problem derives from livestock, generally 100% of the critical area within the watershed must be treated with BMP systems (Meals, 1993).
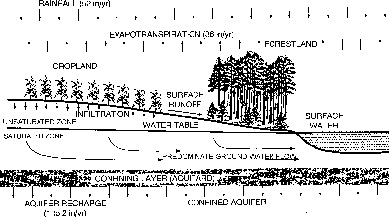
Figure 1. Typical hydrologic cycle for eastern North Carolina (Evans et al., 1991).
Riparian Buffers: What Are They and How Do They Work?
Introduction
In 1998 the Environmental Management Commission (EMC) of North Carolina adopted a set of regulations to reduce nitrogen loading to surface waters in the Neuse River Basin. One of the rules was for the protection and maintenance of existing riparian buffers. Another rule specified agricultural BMPs, of which one was the use of riparian buffers. A similar buffer rule became effective in the Tar-Pamlico River Basin in 2000. Several local governments in North Carolina, such as the Town of Cary, Mecklenburg County and city of Hendersonville, have implemented riparian buffer regulations. Buffers in Cary must be protected at a width of 100 feet, whereas buffers in Hendersonville must be protected at the 50-foot width. These regulations have been enacted specifically to protect water resources from nonpoint source pollution.
Although buffers are being required not only in North Carolina but in many places throughout the world, at the same time a significant fraction of the public and some legislators oppose requiring buffers. Two reasons for this opposition may be 1) a lack of understanding of the benefits and land requirements of buffers and 2) inappropriate placement of some buffers, leading many to conclude that all buffers are ineffective. In fact, buffers are being promoted in areas where they may provide little water quality improvement. Additionally, buffers wider than necessary for water quality purposes are often prescribed or promoted. All of this is further complicated because of different perceptions and understandings about what a riparian buffer is.
The purpose of this manual is to provide the best professional guidance on the selection and placement of BMP systems that will reduce nitrogen, phosphorus and sediment loading from agriculture to surface waters throughout North Carolina.
Definition
Riparian buffers are vegetated areas next to water resources that protect water quality, bank stabilization, and aquatic and wildlife habitat. The formal definition of riparian buffer varies depending on the individual or group defining the term.
The USDA Forest Service defines a riparian buffer as:
The aquatic ecosystem and the portions of the adjacent terrestrial ecosystem that directly affect or are affected by the aquatic environment. This includes streams, rivers, lakes, and bays and their adjacent side channels, floodplain, and wetlands. In specific cases, the riparian buffer may also include a portion of the hillslope that directly serves as streamside habitats for wildlife.
Leading experts (Lowrance, Leonard, and Sherida, 1985) on riparian buffers define them as follows:
A complex assemblage of plants and other organisms in an environment adjacent to water. Without definitive boundaries, it may include stream banks, floodplain, and wetlands, as well as sub-irrigated sites forming a transitional zone between upland and aquatic habitat. Mainly linear in shape and extent, they are characterized by laterally flowing water that rises and falls at least once within a growing season.
Natural riparian buffers are composed of grasses, shrubs, trees, or mixed vegetation. If riparian buffers are maintained or reestablished, they can exist under most land uses: natural, agricultural, forested, suburban, and urban.
What Do They Do and How Do They Work?: Introduction
Since riparian buffers in North Carolina are predominantly forested, discussion in this manual will focus on riparian forest systems. Existing forested riparian buffer systems in North Carolina are typically comprised of two integrated streamside riparian buffers (forest and grass or shrub) that are designed to intercept surface runoff and subsurface flow (Figure 2). Riparian buffers have been shown to be effective in controlling nonpoint source pollution by removing nutrients, especially nitrogen and sediment (USDA, 1997).
There are many factors that determine the effectiveness of riparian buffers for any given pollutant. To understand these factors, it is necessary to understand how riparian buffers work to reduce pollutant movement into surface waters. Movement of water from agricultural land through riparian buffers is illustrated in Figure 2. Sediment and sediment-associated pollutants, such as some pesticides and phosphorus, move to surface waters almost exclusively through surface runoff. Thus, to remove sediment and its associated pollutants, surface runoff water must be intercepted.
The most important factor controlling effectiveness of riparian buffers is hydrology: how the water moves through or over the buffer. For example, removal of contaminants from surface runoff requires that runoff water be sufficiently slowed to allow sediment to settle out. If the runoff water does not spread over the buffer, it will move through the buffer in channels. Channelized water may flow rapidly through a buffer, thereby making the buffer ineffective at pollutant removal (Dillaha et al., 1989).
Most nitrogen from agricultural fields reaches surface water as nitrate dissolved in the groundwater below the soil surface. In order for nitrate to be removed from groundwater before it reaches surface water, the groundwater must enter a zone where plant roots are or have been active. These plant roots may either absorb the nitrate for use in plant growth or, more importantly, may provide an energy source for naturally-occurring bacteria that convert dissolved nitrate to a gas, which then escapes to the atmosphere. This process, denitrification, occurs almost exclusively in water-saturated zones where abundant organic matter is present.
At most monitored riparian buffer sites in North Carolina, including buffers located in the mountains, nitrate concentrations in shallow groundwater were significantly reduced as the water flowed through the riparian buffer (Gilliam et al., 1997: Vose, personal communication). However, it is possible for nitrate to pass below the riparian buffer at depths far enough below the root zone that very little nitrate removal occurs (Correll et al., 1994). Kunickis (2000) found that denitrification was limited when the stream was incised, due to the groundwater flow bypassing the buffer. It is also possible for groundwater to move through the riparian buffer so quickly that removal is limited (Haycock and Pinay, 1993). During a recent hurricane, McLaughlin (personal communication, 1998) found that phosphorus levels in the groundwater increased from almost nondetectable to over 1 ppm, suggesting that flow had reversed and that water was moving from the river system into the groundwater. To quantitatively predict nitrate removal in riparian buffers, it is necessary to understand the hydrology of each site (Hill, 1996). Although there are some locations where riparian buffers are not effective, the research throughout North Carolina and the United States demonstrates that buffers are usually effective in reducing sediment, nitrogen, phosphorus and pesticides.
What Do They Do and How Do They Work?: Buffer Design
Scientists agree that a corridor of vegetation can be effective at buffering valuable aquatic resources from the potential negative impacts of human use of the adjacent land. The streamside vegetated buffer filters nonpoint source pollutants from incoming runoff and provides habitat for a balanced, integrated, and adaptive community of riparian and aquatic organisms (Welsch, 1991). These filtering and habitat functions are often best provided by natural vegetation such as trees and associated woodland or forest plants in the zone directly adjacent to the waterway. While there is general agreement about the benefits of buffers, the specific design criteria, such as buffer width, types of vegetation, and management, are the subject of considerable debate.
Width is the most important controllable variable in determining the effectiveness of buffers in reducing pollutants and protecting stream health. Buffers that are too narrow may not be sustainable or effective at protecting stream banks. Conversely, buffers that are wider than needed limit the use of adjacent land and may be unpopular with landowners. Complicating the determination of design buffer widths are the effects of varying site characteristics associated with topography, hydrology, geology, and land use. Additionally, other factors, such as the value of the water resource and adjacent land, must be considered when determining widths.
The width of most existing riparian forest buffers was established by leaving the area adjacent to the stream as forest. This area was generally too wet or too steep to be used conveniently for agricultural or urban purposes. Welsch (1991) recommended a widely acclaimed riparian buffer system that was 95 feet wide on both sides of the stream. In one of the better reviews available on buffers, Wenger (1999) offered three buffer width options for protection of water resources with decreasing level of protection.
- Option one – 100 feet plus 2 ft for each 1% of slope
- Option two – 50 feet plus 2 ft for each 1% of slope
- Fixed buffer of 100 feet
There is little debate among riparian buffer experts that these wider buffer widths are very good as an idealized system. However, research does not support requiring these widths along every stream. The width necessarily depends upon the functions expected of the riparian buffer and the site characteristics.
Most decisions about buffer widths will be a compromise between ideal widths based on environmental goals (providing wildlife corridors, bank stabilization, water quality protection) and sociologic or economic constraints. Science-based criteria, for which research data may be available to support an informed decision, include the functional value of the water resource; watershed, site, and buffer characteristics; adjacent land use; and buffer function. The functional value of the water resource is important for determining buffer width in that a highly valued resource may merit a wider buffer for increased protection.
Watershed, site, and buffer characteristics are most important when evaluating pollutant-filtering effectiveness. The size and topography of the watershed determine the amount and rate of surface and groundwater passing through the buffer. Site characteristics, such as soil type, slope steepness, microbial populations, and vegetation, determine the amount of pollutants that are filtered out of the water before it enters the waterway. Buffer characteristics, such as the types of vegetation and their location in the buffer, can also influence pollutant removal effectiveness.
One of the most widely recognized buffer planning models is the three-zone buffer that was developed by the USDA Forest Service (Welsch, 1991). Zone one of the model begins at the normal water level or at the edge of the active channel and extends a minimum of 15 feet along a line perpendicular to the watercourse. Dominant vegetation consists of existing or planted woody vegetation suitable for the site and intended purpose. This zone should remain undisturbed; therefore, tree removal is generally not permitted. Zone two begins at the edge of zone one and extends a minimum of 60 feet perpendicular to the watercourse. While vegetation in zone two should be similar to zone one, removal of trees and shrubs is permitted on a regular basis provided the trees and shrubs are replaced. The third zone begins at the outer edge of zone two and has a minimum width of 20 feet. Vegetation in this zone can be grazed or ungrazed grass or other plant communities as long as it facilitates sediment filtering, nutrient uptake, and the conversion of concentrated flow to uniform, shallow, sheet flow through the use of structural practices such as level spreaders (Lowrance et al., 1995).
The current buffer standards in North Carolina use a two-tiered riparian buffer: forested areas near the streams and grassed areas away from the stream. The buffer width is 50 feet: 30 feet of forest and 20 feet of grass (NCDEHNR, 1997). Some streams, however, may need greater or less buffer width, depending not only on site location but also on the pollutant that is being controlled. For optimal performance, riparian forest buffer systems must be designed and maintained to maximize sheet flow and infiltration and impede concentrated flow.
The design also depends on the stream order and the land area that drains the riparian buffer; the larger the drainage area, the wider the buffer width. First and second-order streams generally comprise >95% of the total stream miles in a watershed or river basin (Sweeney, 1993). Since most nonpoint source pollution enters the river system through these first order streams, it is very important to protect the smaller streams with buffers.
Stream networks are designated by using stream orders. First-order streams have no tributaries (Figure 3). A second-order stream starts at the confluence of two first-order streams. The confluence of two second-order streams is a third-order stream and so on (Dingman, 1994).
The other important characteristic of buffer design is vegetation type. It is generally assumed that trees are the preferred streamside vegetation for both nitrate removal and stream health. However, there is very limited scientific data that would indicate that trees are better for nitrate removal than deep-rooted grasses. Because nitrate reduction is dependent on sufficient carbon sources and therefore deeply rooted vegetation, in the Southern U.S., where the subsoils tend to be acid, there is a general belief that tree roots penetrate lower in the profile and thus are more effective in reducing nitrate than most grasses. Trees may also provide stream corridor habitat although in some ecosystems deeply rooted shrubs, grasses and sedges form natural buffer systems.
Sweeney (1992, 1993) analyzed differences in stream structure and function between a forested and grassed riparian system within the same watershed. Ninety-five percent of the streams in this watershed, located in Southeastern Pennsylvania, were first- and second-order streams. Streams with forest buffers were wider and shallower than the grass buffered systems. The shallower systems provided a greater bottom area for macroinvertebrates. Benthic leaf litter was 100 times greater in the forested system than the grassed system. This, in conjunction with the rooting system of the trees, provided significantly more habitat for aquatic insects.
In addition to these physical stream characteristics, Sweeney found that the amount of light reaching the forested stream was seven times less while the stream temperature was 5 degrees Celsius less in the summer and about 2 degrees warmer in the winter. Light and temperature are both important to the survival of aquatic organisms, indicating that conditions under the forested canopy would improve habitat conditions. He also compared the effects of tree species on larval survival. He found that species such as shagbark hickory and sugar and red maple greatly increased cranefly larvae numbers over areas with white, red, or chestnut oak species.
What Do They Do and How Do They Work?: Protect Stream Health
The most general function of riparian forest buffer systems is to provide control of the stream environment. This function includes moderating fluctuations in stream temperature and controlling light quantity and quality; enhancing habitat diversity; modifying channel morphology; enhancing food webs and species richness; and protecting water resources from nonpoint source pollutants such as sediment and nutrients (USEPA, 1995b).
The design specifications for forested riparian buffers should provide the desired function of the buffer at the particular location, whether it is being used to control nonpoint source pollution so that downstream waters do not deteriorate or to protect aquatic organisms.
Habitat: Aquatic Organisms
(The following information on habitat was largely taken from USDA’s Riparian Forest Buffer Handbook for the Chesapeake Bay Watershed, 1997. Thanks to Al Todd for providing the draft version of this document.)
The riparian buffer is an important feature of stream habitat. The vegetation of the riparian buffer affects the type and amount of organic matter food sources available for stream organisms. Streamside vegetation also affects the amount of sunlight that reaches the stream and, in turn, the temperature of the water. In addition, the physical structure of the stream, such as the extent of pools and riffles, is affected by riparian vegetation. Climate and watershed characteristics also affect aquatic life habitat. All of these factors influence species diversity and abundance.
Food. Food sources for macroinvertebrates include detritus and algae. Detritus is organic matter such as leaves, stems, sticks, and logs that falls into the stream. Because their mouth parts are adapted for a particular food source, some macroinvertebrates eat primarily detritus and others eat only algae. Two types of algae found in streams are diatoms and filamentous algae.
The vegetation in the riparian buffer affects the type and quantity of detritus that occurs in the stream. It is likely that vegetation that falls into the stream generally does not move very far away so that the food benefits are highly localized to the immediate stream corridor. Older stratified forests may provide the greatest variation in quality of detritus food for macroinvertebrates.
Vegetation also affects the amount of light that reaches the stream, but this is a function of stream order and stream width as well. For first-, second-, and third-order streams, the riparian canopy of trees can block sunlight from reaching the water. A shaded stream is likely to have more diatoms and less filamentous algae. A stream that runs through a cleared riparian buffer or one that has meadow vegetation is likely to have more filamentous algae. The detritus food source from the clearing of a riparian buffer is only temporary as detritus rapidly decays. For grassed riparian buffers, filamentous algae is likely to dominate. Also, large streams and rivers will receive a large portion of direct sunlight, which encourages filamentous algal production in open areas. Nearshore areas bordered by mature vegetation are likely to have diatoms and sufficient detritus.
Temperature and light. Vegetation type, canopy development, and directional orientation of the stream control light energy and impact stream temperature. A north-south oriented stream is less affected by buffer canopy shading. The vegetation on the north side of an east-west oriented stream may also have little effect on light penetration. For first-, second-, and third-order streams, the majority of water flows through a shaded riparian buffer. For higher order streams, which are wide and open in cross-section, shading has less of an impact on water temperature. However, the loss of the buffer canopy on any stream, due to clearing, can increase water temperature substantially, causing a shift in macroinvertebrate and fish species.
Physical habitat (pools, riffles, etc.). Roots of riparian vegetation stabilize the stream bank and prevent stream bank erosion and sedimentation. Stabilized stream banks also help maintain the geometry of the stream, including characteristics such as the meander length and profile. Preventing excess sedimentation helps keep silt from covering large rocks and stones, which serve as habitat for some macroinvertebrates, in the stream bed. Pools can be vital parts of stream habitat for fish. Excess sediment can fill pools and eliminate habitat. Tree roots and woody debris are also important habitat features for macroinvertebrates and fish. Overhanging stream banks, stabilized by tree roots and large woody debris, can be important habitat for fish.
Large woody debris provides critical macroinvertebrate habitat. Large woody debris can also create dams and trap sediment and detritus. Riparian forests may have the greatest enhancing effect on fish habitat on mid-order streams (i.e., stream order 3 to 6) when these streams have sufficient large woody debris structure and flow to support diverse fish and macroinvertebrate populations.
Habitat: Wildlife
Wildlife species require food, water, and cover. Well-managed riparian buffers generally support larger populations of wildlife because the buffer provides many habitat requirements. In a stratified forest, different habitat zones exist vertically, including the soil-air interface, herbs and shrubs, intermediate-height trees, and the canopy. Included with the leaf litter and rotting logs at the soil-water interface are insects, isopods, spiders, and mites. These organisms are a food source for reptiles, mice, and birds. The herbs and shrubs provide habitat for insects, birds, and mammals. The intermediate zone and the canopy serve as habitat for birds, bats, squirrels, opossums, and raccoons. Bird habitat may be highly stratified, and birds generally show a preference for certain layers that differ in habitat characteristics and food sources.
Riparian areas may also serve as corridors linking dryer, less diverse uplands to moister, more diverse bottom lands. The width of riparian buffers needed for wildlife is not clear. This may be a function of the type of wildlife and their vegetation requirements. Upland game birds, such as pheasant and bobwhite quail, benefit from grasses. A stratified forested may be needed to maintain wrens and robins in a herbaceous zone and tree-creeping birds and robins in the canopy.
What Do They Do and How Do They Work?: Reduce Nitrogen
In the Coastal Plain of North Carolina, most nitrogen enters surface waters from groundwater as nitrate-nitrogen. As the shallow groundwater moves through the riparian buffer, microorganisms change the nitrate-nitrogen to gaseous nitrogen via a process known as denitrification (Figure 4). When the soil is poorly aerated (anaerobic conditions), some microorganisms reduce nitrates to the gaseous components of nitrous oxide, nitric oxide, or free nitrogen gas.
Denitrification is most effective in root-zone soil layers where carbon sources are available for the denitrifying bacteria. Numerous researchers have reported that it is the complex interaction between vegetation and the below-ground environment that provides the appropriate conditions for denitrification to occur (Lowrance et al., 1995). The area of interaction within the riparian buffer is generally quite narrow —10 to 50 feet (or 3 to 15 meters) — from the field through the riparian buffer. The majority of denitrification that has been observed in riparian buffers occurred within the first 15 feet of the forested riparian buffer.
The effectiveness of riparian buffers at removing nitrate varies greatly. The effect of buffer width on nitrate removal is shown in Figure 5. The data used to construct this figure were taken from a number of studies throughout the U.S. and Europe. It is clearly understood from the body of studies undertaken that the primary cause of the variation in effectiveness is a result of differences in hydrology. A number of researchers (Correll and Weller, 1989; McDowell et al. 1992; Gilliam, 1994; Groffman et al., 1991) have warned that not all buffers are effective for nitrate removal. Hill (1996) has stated, “Knowledge of hydrology is essential to an understanding of riparian zone chemistry.” Unfortunately in the promotion of buffers, the fact that they are not equally effective in all situations is often misunderstood, overlooked or ignored.
Denitrification as measured in Southeastern U.S. Coastal Plain forested riparian buffer areas has removed as much as 263 lb N acre-1 yr-1. Typically, though, denitrification rates are generally between 18 and 55 lb N acre-1 yr-1. Most studies indicate that denitrification takes place throughout the year (Lowrance et al., 1995).
Ideal Conditions for Denitrification. Research has clarified the hydrologic conditions where buffers are most effective for nitrate removal and where the presence of a vegetative buffer does very little to increase nitrate removal from the groundwater. Under ideal conditions for nitrate removal by a riparian buffer, an aquatard is present at relatively shallow depth (>5 m in upper part of field; <1.5 m in riparian area; Figure 6a). Before most of the subsurface drainage water from the field reaches receiving waters, it must pass through a zone where plant roots can absorb the nitrate and/or provide organic matter for microbes to denitrify the nitrate, or both. The early studies mentioned above (Lowrance et al., 1983; Peterjohn and Correll, 1984; Jacobs and Gilliam, 1985) were conducted in locations where the hydrologic conditions met these criteria. Each of the studies measured 80 to 95% nitrate removed from the groundwater before it reached the stream.
Ineffective Conditions for Denitrification. The most ineffective condition for nitrate removal in a riparian zone is shown in Figure 6b. Under these conditions most or all of the groundwater passing through the riparian zone is at a depth where the roots of the plants growing in the riparian zone have little or no interaction with the groundwater. There is no chance for plant uptake of the nitrogen and there is little contribution of organic matter to the groundwater by the plants in the riparian zone (Groffman et al.,1991; Lowrance, 1992 ). Some denitrification may occur in this zone, but it is not a result of the presence of a riparian buffer. The organic matter already present in the sediments near the stream or organic contributions to the water by plants upslope of the riparian area provide a carbon source for the denitrification. The denitrification under this hydrologic condition would have occurred even if no buffer were present.
Varying Hydrologic Conditions Produce Varying Levels of Denitrification. Figures 6A and 6B depict the opposite ends of the nitrate removal spectrum — from the best to the worst. Certainly there are many hydrologic conditions between these extremes. For example, Figure 6c depicts a situation where a portion of the drainage water can interact with roots in the riparian zone, but much of the water passes through the riparian zone at a depth that is influenced only slightly or not at all by the plants above. In effect, the drainage water simply bypasses the filtering function of the buffer. In this situation, the riparian zone helps in nitrate removal, but is less effective than would be desired. Some scientists and regulators have estimated buffer removal of nitrate to range from 40 to 85% under conditions where the water table has some contact with plant roots (Osmond et al., 2001), but there is no accepted procedure for accurately predicting nitrate removal in buffers under less than ideal conditions.
When surface runoff ditches run through buffers, are the buffers still effective in reducing nonpoint source pollution? Because most nitrate moves through the shallow groundwater, these small drainage ditches should have only minimal impact on the effectiveness of buffers to dentrify nitrate. The ditches are moving only surface water, which contains little nitrogen. These field drainageways do not add additional barriers to nitrate removal if hydrologic conditions are such that the subsurface flow bypasses the filtering effects of the buffer anyway. If the ideal hydrologic conditions exists (an aquatard is present at relatively shallow depth (>5 m in upper part of the field; <1.5 m in riparian area), then subsurface denitrification will occur in the buffer. Since surface flow through the buffer is important for the other pollutants, such as sediment, phosphorus, and many pesticides, by altering the sheet flow through the buffer and concentrating the flow in the ditches, the buffers will not be effective in reducing these pollutants.
Vegetation in riparian buffers also removes nitrogen and phosphorus through uptake. Some of these nutrients are sequestered in woody vegetation, whereas the nutrients absorbed into herbaceous materials generally are recycled as the vegetative matter dies. Several studies have indicated that uptake by above-ground woody vegetation removes various amounts of nitrogen and phosphorus, depending on the riparian conditions (Table 1).
Table 1. Above-ground woody vegetation uptake of nitrogen and phosphorus in Coastal Plain riparian forests (from Lowrance et al., 1995).
| Reference | Location | Nitrogen | Phosphorus | ||
|---|---|---|---|---|---|
|
Total Input (kg ha-1 yr-1) |
Woody Storage (kg ha-1 yr-1) |
Total Uptake (kg ha-1 yr-1) |
Woody Storage (kg ha-1 yr-1) |
||
| Correll & Weller, 1989 | Rhode R., MD | ND* | 12 to 20 | ND | 3 to 5 |
| Peterjohn & Correll, 1984 | Rhode R., MD | 77 | 12 | 10 | 1.7 |
| Fail et al., 1986 (mean) | Little R., GA | 114 | 52 | 7.5 | 3.8 |
| Fail, 1986 (maximum) | Little R., GA | 194.4 | 97.6 | 12.6 | 6.9 |
| Fail, 1986 (maximum) | Little R., GA | 80 | 34.6 | 4.5 | 1.9 |
*ND = not determined ↲
Although nitrogen uptake by the vegetative portion of the riparian buffer contributes to nitrogen reductions, denitrification is the primary process that removes nitrate from the shallow groundwater that flows through riparian buffers.
What Do They Do and How Do They Work?: Reduce Sediment, Phosphorus, and Pesticides
Riparian buffers, both the grassed and forested portions, serve to slow water velocity, thus allowing sediment to settle out of the surface runoff water. The grassed portion of the buffer functions as a grass vegetated filter strip. There is extensive research demonstrating the effectiveness of vegetated filter strips for sediment removal (Lowrance et al., 1995).
The effectiveness of well maintained grass riparian buffers for sediment removal may be as high as 90 to 95%. Likewise, nitrogen and phosphorus attached to the sediment and, to a lesser extent, dissolved nitrogen and phosphorus are abated. Frequently, the concentration of dissolved nutrients in the runoff passing over a grass filter does not change or may slightly increase. However, because some of the runoff water infiltrates in the buffer, less runoff water leaves the buffer than enters it. For example, we have observed that a 24-foot grass filter prevented any runoff in half of all rainfall events. The larger the runoff event, the lower the percent reduction by the filter but there was a reduction. Thus, since the volume of water leaving the filter is less, there is a reduction in total amount of dissolved nutrients that leaves the filters even though nutrient concentration may not change. These filter strips are not designed for high velocity flow but, rather, are used to slow flows so that sediment drops out. Because grass riparian buffers are designed to trap sediment, they require maintenance to remain effective (Dillaha et al., 1989).
In experiments conducted to determine optimum width of a grass riparian buffer adjacent to a forested riparian buffer, Parsons (personal communication, 1997) determined sediment reduction for different grass riparian buffer widths. Approximately 100 data points were collected for storms that produced >1000 g of sediment loss at the edge of the field. The percent sediment reduction is calculated as 1.0 – [(grass buffer loss)/(field edge loss)]. In the Piedmont, 28 feet of buffer width retarded sediment such that there was 86 to 90% reduction (Table 2), whereas the narrower buffer width of 14 feet reduced sediment loss by 70%. By contrast, the difference in sediment reduction between grass buffer widths of 14 and 28 feet was not as marked at a Coastal Plain location: 86% reduction for buffer widths of 28 feet and 76.5% reduction for 14-foot grass riparian buffers (Table 3).
| Grass Buffer Width | Plot | % Reduction |
|---|---|---|
| 14 ft | 1 | 71 |
| 14 ft | 2 | 68 |
| 28 ft | 1 | 90 |
| 28 ft | 2 | 86 |
| Grass Buffer Width | Plot | % Reduction |
|---|---|---|
| 14 ft | 1 | 70 |
| 14 ft | 2 | 83 |
| 28 ft | 1 | 82 |
| 28 ft | 2 | 90 |
Grass riparian buffers in combination with forested areas appear to do the best job of reducing both sediment and phosphorus, as can be seen from the following table. The effects of different riparian buffer widths in reducing sediment, nitrogen, and phosphorus are presented in Table 4.
| Buffer Width (m) | Buffer Type | Sediment | Nitrogen | Phosphorus | ||||||
|---|---|---|---|---|---|---|---|---|---|---|
|
Input Conc. (mg L-1) |
Output Conc. (mg L-1) |
Reduction4 (%) |
Input Conc. (mg L-1) |
Output Conc. (mg L-1) |
Reduction4 (%) |
Input Conc. (mg L-1) |
Output Conc. (mg L-1) |
Reduction4 (%) |
||
| 4.61 | Grass | 7284 | 2841 | 61.0 | 14.11 | 13.55 | 4.0 | 11.30 | 8.09 | 28.5 |
| 9.21 | Grass | 7284 | 1852 | 74.6 | 14.11 | 10.91 | 22.7 | 11.30 | 8.56 | 24.2 |
| 19.02,3 | Forest | 6480 | 661 | 89.8 | 27.59 | 7.08 | 74.3 | 5.03 | 1.51 | 70.0 |
| 23.65 | Grass/Forest | 7284 | 290 | 96.0 | 14.11 | 3.48 | 75.3 | 11.30 | 2.43 | 78.5 |
| 28.26 | Grass/Forest | 7284 | 188 | 97.4 | 14.11 | 2.80 | 80.1 | 11.30 | 2.57 | 77.2 |
1 Calculated from masses of total suspended solids, total N, total P, runoff depth, and plot size (22 x 5 m) from Magette et al. (1989). ↲
2 Input concentrations from Table 2, Peterjohn & Correll (1984). Nitrogen = Nitrate-N + exch. part. ammonium + diss. ammonium + part. organic N + diss. organic N. Phosphorus = part. P + diss. P. ↲
3 Surface runoff concentrations at 19 m into forest reported by Peterjohn & Correll (1984). N and P constituents same as input (footnote 2). ↲
4 Percent reduction = 100 * (Input-Output)/Input. ↲
5 4.6 m grass buffer plus 19 m of forest. ↲
6 9.2 m grass buffer plus 19 m of forest. ↲
conc. = concentration.
Because most phosphorus loss is so closely tied to erosion, the above discussion on riparian buffers and sediment is relevant to the control of sediment-attached phosphorus. However, dissolved phosphorus is an additional source of phosphorus and most solution phosphorus is not removed by buffers. A newly constructed buffer may adsorb entering dissolved phosphorus for a short time, but the sediments deposited in the buffer soon become a source of dissolved phosphorus, including vegetation die-off. In some instances, loads of dissolved phosphorus out of a buffer may actually be greater than loads of dissolved phosphorus into the buffer. This situation can result from the water entering the buffer contains less dissolved phosphorus than the concentration of phosphorus in sediments that have been trapped by the buffer. Under this condition, the sediments may contribute dissolved phosphorus to the water flowing over them thus increasing the phosphorus concentrations leaving the buffer (Cooper and Gilliam, 1987). In general, riparian buffers remove approximately 50% of the total phosphorus (Figure 7).
As noted previously, vegetative uptake of phosphorus is another reduction mechanism. Researchers have shown (Table 1) that between 2 lb and 12 lb P acre-1 year-1 are absorbed by the above-ground woody vegetation in Coastal Plain riparian forests (Lowrance et al., 1995).
A recent summary characterized the effectiveness of riparian buffers in reducing pesticides (USDA, NRCS, 2000). Researchers stated that the effectiveness of buffers was closely linked to the pesticide’s affinity to be adsorbed to soils. The average percent pesticide trapped ranged between 57 and 100% for highly adsorbed pesticides (e.g., lindane, trifulralin, and chlorpyrifos). Herbicides strongly sorbed to sediment will be reduced by sediment deposition in buffers. The trapping efficiency of moderately adsorbed pesticides, such as atrazine, metolachlor and cyanazine, ranged from 8 to 100% efficiency. In general, depending on conditions and buffer widths and types, average effectiveness was around 50 to 60%. Results on the effectiveness of moderately sorbed herbicides demonstrate that reductions are due primarily to infiltration.
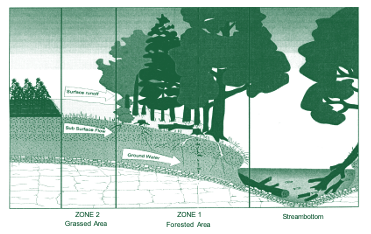
Figure 2. Schematic of the two-zone riparian forest buffer system (modified from Lowrance et al., 1995).
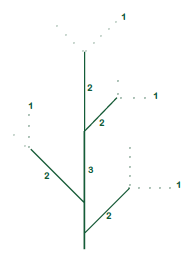
Figure 3. Stream order designations.
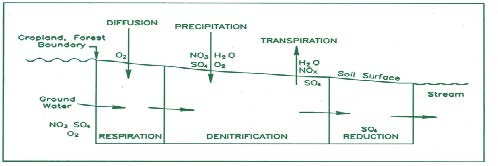
Figure 4. Conceptual model of below-ground processes affecting groundwater nutrients in riparian forest (Correll and Weller, 1989).
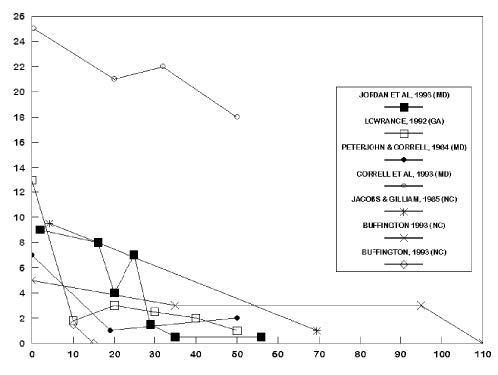
Figure 5. Nitrate concentrations in groundwater beneath riparian forests.
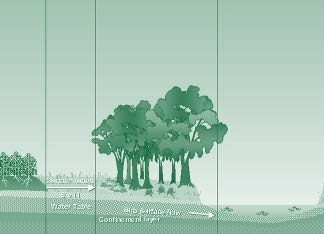
Figure 6a. Groundwater flow paths most conducive to denitrification.
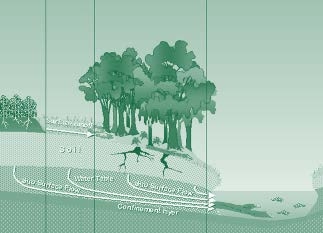
Figure 6b. Groundwater flow paths less conducive to denitrification.
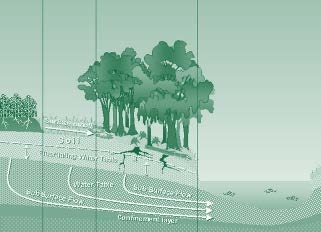
Figure 6c. Groundwater flow paths sometimes conducive and sometimes not conducive to denitrification.
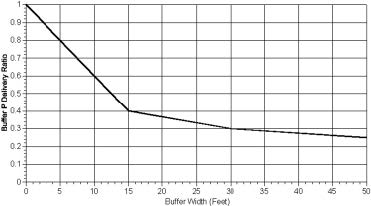
Figure 7. Buffer width and phosphorus retention effectiveness.
Controlled Drainage: What is it and How Does it Work?
Water Table Management
Drainage has long been an important component of agricultural land management in the Coastal Plain and Tidewater regions of North Carolina. On flat, poorly drained soils, intensive drainage is necessary to facilitate seedbed preparation and planting in order to minimize plant stress and subsequent yield reduction resulting from poor soil aeration that accompanies waterlogging. Nearly half of the cropland currently used in North Carolina requires drainage improvement for efficient production. The drainage intensity required for agricultural production is not the same in all years or all periods of the year. While wetness is the major concern, weather conditions vary such that crops periodically suffer from drought stress that may substantially reduce yields in some years. Intensive drainage systems, necessary to enhance trafficability during extreme wet periods, often remove more water than necessary during drier periods, leading to temporary overdrainage (Doty et al., 1986).
Problems with drought on drained soils have resulted in a transition from conventional drainage methods to water table management systems. The latter provide drainage during wet periods, but utilize control structures to manage the water level in the drainage outlet, making it possible to reduce overdrainage. In some cases, the system can be used to provide subirrigation during dry periods. Collectively, these practices are referred to as water table management and involve a combination of management practices including surface drainage, subsurface drainage, controlled drainage, and/or subirrigation.
Types of Drainage Systems: What They Do and How They Work
Drainage is accomplished by two methods: open-ditch systems designed to provide primarily surface drainage (surface runoff) (Figure 8) or underground systems comprised of drain tile or tubing designed to lower the water table by subsurface flow. A surface drainage system typically consists of 3- to 5-foot deep open ditches installed on 300- to 600-foot intervals. Surface runoff develops when the rate of rainfall exceeds the soil’s capacity to absorb water, thereby resulting in surface ponding. Shallow surface drains (hoe drains) are often utilized to effectively convey ponded surface water to ditches. Vegetated field borders and drop inlet pipes are used to stabilize ditch banks and minimize erosion while conveying surface runoff from the surface drains into the ditch.
Subsurface drainage is obtained by buried tile or tubing (4- to 6-inch diameter) that is placed 3 to 5 feet deep and 50 to 200 feet apart. A subsurface system provides drainage when the water table rises above the drain depth and water flows toward and into the drain. The drainage process whereby water infiltrates into the soil and moves within the soil profile is referred to as subsurface drainage, shallow groundwater flow, or sometimes interflow.
In practice, it is often difficult to differentiate between surface and subsurface drainage, particularly in Eastern North Carolina, because the outflow in drainage ditches or canals is usually a combination of both surface and subsurface flow. The relative proportion of surface and subsurface flow in the total drainage volume depends on many factors. These include rainfall intensity, land surface roughness and slope, vegetation, soil permeability, and ditch or drain tubing spacing and depth. Open ditches are normally spaced farther apart than buried tubing, which typically causes subsurface flow to be slow, resulting in collection of predominately surface drainage. But in highly permeable soils, open ditches may provide significant subsurface drainage. Such is the case in the Tidewater and Lower Coastal Plain, where many fields are underlain by highly permeable sands at shallow depths, typically within 3 to 6 feet of the soil surface. Under such conditions, the drainage in open ditch systems is often predominately subsurface flow even though the ditch system is referred to as a surface drainage system.
Drainage and Water Quality
Nitrogen and phosphorus are transported from land-based activities to receiving streams and estuaries by drainage of excess rainfall. The difference in drainage method (surface versus subsurface flow) is important from a water quality standpoint because the characteristics of the two drainage waters differ. Surface drainage systems result in rapid removal of excess water over a relatively short time period. This water flowing over the land surface has relatively high energy sufficient to detach and transport soil particles and constituents attached to them, such as phosphorus, organic nitrogen, and many pesticides (Gilliam et al., 1978; Skaggs and Gilliam, 1981; Deal et al., 1986). Subsurface drainage typically contains very little sediment, but contains high concentrations of soluble constituents such as nitrate-nitrogen (Gilliam et al., 1978; Skaggs and Gilliam, 1981; Skaggs et al., 1982; Evans et al., 1987; Deal et al., 1986). Field research has documented nitrogen losses in drainage water from the edge of agricultural fields to average about 20 lbs nitrogen acre-1 year-1. Site-to-site and year-to-year variation ranges from none to over 40 lbs nitrogen acre-1 year-1 . Factors causing this variability include land use, type of drainage, drainage intensity, and variability in rainfall, soil, landscape position, fertilization rate, type of crop, and harvested crop yield.
Controlled Drainage
Water control structures, such as a flashboard riser, installed in the drainage outlet allow the water in the drainage outlet to be raised or lowered as needed. This water management practice has become known as controlled drainage. When the flashboards are lowered or removed, subsurface drainage occurs more quickly (Figures 9a and 9b). When flashboards are added to the riser, the subsurface drainage rate is decreased and the height of the water level in the ditches and surrounding fields rises. Managing the field water through the use of controlled drainage allows timely drainage but also maximum storage of water within the field for utilization by the crop.
The transport of nitrogen from drained fields can be minimized by managing the drainage system such that only the minimum drainage water necessary is allowed to exit the field. In numerous field studies (Gilliam et al., 1978, 1979; Skaggs et al., 1982; Deal et al., 1986; Evans et al., 1989), drainage control reduced the annual transport of total nitrogen at the field edge by 9 lbs acre-1 year-1 or 45% on average. Nitrogen reductions resulting from controlled drainage result from two processes. First, controlled drainage reduces the volume of drainage water leaving a field by 20 to 30% on average; however, outflow varies widely depending on soil type, rainfall, type of drainage system, and management intensity. During dry years, controlled drainage may totally eliminate outflow. In wet years, control may have little or no effect on total outflow. Second, controlled drainage provides a higher field water table level, which promotes denitrification within the soil profile. In some cases, nitrate-nitrogen concentrations have been 10 to 20% lower in outflow from controlled systems compared to uncontrolled, free-draining systems. The combined effect of reduced flow and reduced nitrate concentration results in the overall 45% reduction in nitrogen mass transport at the field edge. Controlled drainage has also been documented to reduce phosphorus transport by 0.1 lbs acre-1 or roughly 35% (Figures 10a, 10b, and 10c).
Management Recommendations
The successful management of controlled drainage systems focuses on two important objectives. The first is achieving optimum production efficiency and maximum nutrient utilization by the crop; the second is attaining maximum water quality benefits. Controlled drainage structures require that the topography be relatively flat. The costs to production and water quality will usually exceed benefits when the land slope exceeds 0.5%. As a consequence, controlled drainage is most practical in the Lower Coastal Plain and Tidewater regions of North Carolina. The predominant cropping sequence in these areas is a two-year rotation of corn, wheat, and soybean. General guidelines for management of controlled drainage under this cropping sequence are given in Table 5.
The general guidelines present an attempt to achieve a balance between production and water quality goals. Many of the management indicators are hidden from view, and the response to adjustments is not immediate. Intensive management with long-term monitoring is necessary to develop a site-specific understanding of the system. Productivity and water goals are compatible during some years, or at least seasonally during most the year. Under some conditions, however, productivity, water quality, or both goals may need to be mutually compromised for the benefit of the other. For example, management throughout the year is necessary to achieve maximum water quality benefit and drainage control to reduce nitrogen transport is most effective during winter and early spring periods. When fields are fallow, there is no significant production cost associated with holding water levels high to achieve the maximum water quality benefit. But productivity of some crops such as winter wheat may be reduced by high winter water table levels.
| Period | Production Activity | Control Settinga (inches) | Commentsb |
|---|---|---|---|
| Jan. 1 – Mar. 15 | Fallow | 12 – 18 | Minimize drainage outflow and encourage denitrification. |
| Mar. 15 – Apr. 5 | Tillage, corn seedbed preparation, planting | 30 – 36 | Just deep enough to provide trafficability and good conditions for seedbed preparation. |
| Apr. 15 – May 15 | Corn establishment, early growth | 24 – 30 | Deep enough to promote good root development. |
| Apr. 15 – May 15 | Nitrogen sidedressing | 24 – 36 | Just low enough to allow trafficability. |
| May 15 – Aug. 15 | Corn development and maturity | 18 – 24 | Temporary adjustment during wet periods |
| Aug. 15 – Oct. 15 | Harvesting, tillage; planting of wheat | 30 – 36 | Lower enough to provide trafficability. |
| Oct. 15 – Mar. 1 | Wheat establishment | 18 – 24 | Lower during extremely wet periods. |
| Mar. 1 – Mar. 15 | Sidedressing wheat | 30 – 36 | Low enough to provide trafficability. |
| Mar. 15 – Jun. 15 | Wheat development | 18 – 24 | Temporary adjustment during wet periods. |
| Jun. 15 – Jul. 15 | Harvesting wheat; tillage, planting of soybeans | 30 – 36 | Depends on rainfall. |
| Jul. 15 – Nov. 1 | Soybean development and maturity | 18 – 24 | Temporary adjustment to allow cultivation. |
| Nov. 1 – Dec. 15 | Soybean harvesting | 36 – 42 | Low enough to provide trafficability. |
| Dec. 15 – Mar. 15 | Fallow | 12 – 18 | Minimize drainage outflow and encourage denitrification. |
a Values shown are the control setting (depth below average surface elevation) and should not be considered the actual water table depth in the field, which will be lower except during drainage periods. ↲
b Most adjustments are related to trafficability and must take into account weather conditions and soil water status at the time:
– in an unusually dry season, control can be 3 to 6 inches higher;
– in an unusually wet season, control should be 3 to 6 inches lower;
– in coarse-textured soils, trafficability can be provided with the water table approximately 6 inches higher. ↲
Although controlled drainage may provide water quality benefits, the same stream health benefits provided by riparian buffers are not realized, particularly on large channelized streams (Correll, personal communication, 1997).
Figure 8. Surface drainage system.
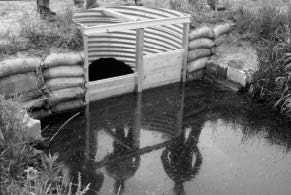
Figure 9a. Controlled drainage showing flashboard riser.
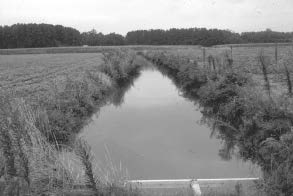
Figure 9b. Water prof ile in drainage ditch upstream of flashboard riser (see 9a).
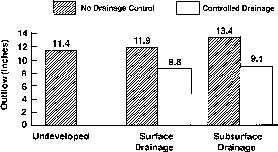
Figure 10a. Average annual outflows measured from 14 sites in eastern North Carolina. The values shown represent approximately 125 site-years of data (Evans et al., 1991).
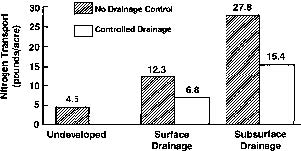
Figure 10b. Average annual nitrogen transport (TKN and NO3-N) in drainage outflow as measured at the field edge for 14 soils and sites (Evans et al., 1991).
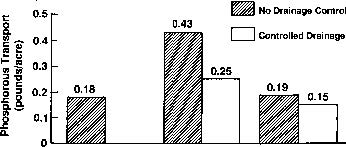
Figure 10c. Average annual total phosphorus transport in drainage outflow as measured at the field edge for 12 soils and sites. Values shown are for mineral soils only. Two sites with organic soils were not included (Evans et al., 1991).
Stream Modifications
Streams themselves can be sources of nonpoint source pollution. In addition, some in-stream features can abate nonpoint source pollution. Stream bank erosion is a source of sediment and, potentially, nutrients. Channelized streams, due to more rapid water velocity, can deliver more pollutants than natural, meandering streams. Wetlands can reduce not only sediment but nitrogen and phosphorus. Features of streams and their effects on nonpoint source pollution and pollution control are discussed below.
In-stream Wetlands
(Most of the information on wetlands was taken directly from Osmond et al., 1995a.)
Definition of Wetlands
Numerous definitions exist for wetlands. Under Section 404 of the Clean Water Act, wetlands are defined as follows:
those areas that are inundated or saturated by surface or groundwater
(hydrology) at a frequency and duration sufficient to support, and that under normal circumstances do support, a prevalence of vegetation (hydrophytes) typically adapted for life in saturated soil conditions (hydric soils). Wetlands generally include swamps, marshes, bogs, and similar areas (40 CFR 232.2 r).
The U.S. Fish and Wildlife Service defines wetlands as follows:
lands that are transitional between terrestrial and aquatic systems where the water table is usually at or near the surface or the land is covered by shallow water, and that have one or more of the following attributes:
- At least periodically, the land supports predominantly hydrophytes;
- The substrate is predominantly undrained hydric soil; and
- The substrate is non-soil and is saturated with water and covered by shallow water at some time during the growing season of each year.
Functions and Values of Wetlands
Wetlands play a critical role in regulating the movement of water within watersheds as well as the global water cycle. Wetlands store precipitation and surface water and then slowly release the water into associated surface water and groundwater and the atmosphere. Wetland types differ in their capacity to store and release water based on physical and biological characteristics that include such factors as landscape position, soil saturation, the fiber content/degree of decomposition of the organic soils, vegetation density, and type of vegetation.
Besides providing hydrologic flux and storage functions that reduce flooding, wetlands also provide biogeochemical cycling and storage that benefits water quality. Wetlands may be a sink for or transform, nutrients, organic compounds, metals, and components of organic matter. Wetlands may also act as filters of sediments, pathogens, and organic matter. Beaver impoundments or created in-stream wetlands can be extremely useful in agricultural watersheds because they can retain up to 1,000 times more nitrogen than streams that are not impounded (Whigham et al., 1988).
Another function of wetlands is biological productivity. Wetlands are among the most productive ecosystems in the world and they play an integral role in the ecology of the watershed (Mitsch and Gosselink, 1993). Wetland plants provide breeding and nursery sites for wildlife, resting areas for migratory species, and refuge from predators (Crance, 1988). Decomposed plant matter (detritus) released into the water is important food for many invertebrates and fish, both in the wetland and in associated aquatic systems.
Wetlands provide community structure and wildlife support to many mammals (beavers, muskrat), amphibians (frogs), reptiles (alligators, lizards), waterfowl, and insects. Wetland shape and size affect the wildlife community and the wetland’s function as a suitable habitat (Kent, 1994; Brinson, 1993). The shape of the wetland varies the perimeter to area ratio. The amount of perimeter versus area has importance for the success of interior and edge species. Larger wetlands are necessary to support animals, such as black bear, that need larger and wider ranges.
Although some wetland systems are precipitation-dominated systems, most natural wetlands in the Coastal Plain of North Carolina are dominated by surface and ground-water flow. Forested riparian wetlands, tidal freshwater marshes, and tidal salt marshes are examples of wetlands supported from surface and groundwater flow.
Created In-stream Wetlands
In-stream wetlands can be created on small streams by impounding or adding a control structure to the stream. Mitsch (1993) observed that creation of in-stream wetlands is a reasonable alternative only in lower-order streams. Such wetlands are susceptible to reintroduction of accumulated pollutants in large flow events and may be unpredictable with regard to system stability. Construction of created in-stream wetlands is legal only if the U.S. Army Corps of Engineers has permitted the site under Section 404 of the Clean Water Act.
Construction or restoration of created in-stream wetlands provides an opportunity to control nonpoint source pollution, regulate water storage, and provide habitat for both aquatic and nonaquatic species. The creation of new or restoration of drained wetlands will create a “marsh like” wetland (Gannon et al., 1995).
In order for created in-stream wetlands to function most effectively in controlling nonpoint source pollution, they must be located in optimal sites in the watershed. Created in-stream wetlands should be placed bordering agricultural fields and in the upper reaches of the watershed, along first- and second-order streams. Created in-stream wetlands can more effectively reduce runoff and erosion for an entire watershed if they are correctly positioned within the upper reaches of the watershed than could the same acreage of created wetlands put into large wetlands low in the watershed (van der Valk and Jolly, 1993). In addition, phosphorus retention and total nonpoint source pollution control is more efficient if the created in-stream wetlands are placed on the lower order streams (higher in the watershed) (Mitsch, 1993). Mitsch (1992) found that created in-stream wetlands controlled 63 to 96% of the phosphorus and 88 to 98% of the sediment.
Constructed Wetlands
Constructed wetlands, as opposed to created in-stream wetlands, are built outside of the stream channel. They are engineered systems designed to simulate natural wetlands to exploit the water purification function of wetlands for human use and benefits. Constructed wetlands consist of former upland environments that have been modified to create poorly drained soils and wetland flora and fauna for the primary purpose of contaminant or pollutant removal from wastewaters or runoff (Hammer, 1992). Constructed wetlands are generally built for the express purpose of treating animal wastewater, on-site wastewater, or processing facility wastewater (Hammer, 1992). Constructed wetlands may also be built to control runoff from cropland or animal operation facilities.
Stream Bank Stabilization
Stream bank erosion is a natural process. Streams naturally erode their banks at a slow rate along the outer toe of a meander bend while depositing sediment along the inner meander bend, forming point bars. As more impervious surfaces are created in watersheds, the flow regime changes, routing more runoff to streams and less into the ground. The result is an increase in stream velocity and energy and a subsequent increase in stream bank erosion. Activities that cause stream bank erosion include agricultural practices that denude the bank of vegetation; cattle access to streams, which dislodges soils, destroys vegetation, and weakens soil structure; channelization and urbanization, which increase stream velocity and energy; and other activities (Thompson and Green, 1994).
Often the first step in restoring a riparian buffer is to stabilize the stream banks. This is especially true in lower order streams (stream order 1-3).
The ability of a stream bank to resist erosion is determined by the following factors:
- relative degree of channel incision;
- riparian vegetation rooting depth and density of roots;
- composition and structure of stream bank materials;
- stream bank slope;
- relative (shear stress) of the water acting on the eroding bank toe; and
- bank surface protection by vegetation and woody debris (Rosgen, 1996).
Typically, human activities accelerate stream adjustment and consequently accelerate stream bank erosion. Therefore, it is of vital importance to identify the cause of stream bank erosion before a solution is prescribed.
Physiographic Regions and Recommended BMPs
Introduction
North Carolina is divided into three physiographic regions: the Coastal Plain, the Piedmont, and the Mountains. Sixty-four percent of all agriculture (3,472,194 acres) occurs in the Coastal Plain, whereas 26% of agricultural lands are found in the Piedmont (590,735 acres), and 10% in the mountains (86,335 acres). The primary pollutants from agricultural land use are sediment, nutrients (nitrogen and phosphorus), fecal coliform, and pesticides. Sediment and nutrients cause the greatest impairment.
Coastal Plain
The land area of the Coastal Plain comprises 45% of the State of North Carolina. This region is rather flat in most areas, but the topography, or land surface, has more rolling hills in the western portion of the Coastal Plain. Elevations in the Coastal Plain range from sea level to 660 feet (200 meters). The soils in the Coastal Plain are relatively uniform compared to soils found in the Piedmont.
The Coastal Plain geology consists mostly of marine sedimentary rocks. This rock is overlain by fluvial deposits. Sand and clay are the primary sediment types, although some limestone occurs in the southern portion of the Coastal Plain. Coastal Plain soils developed from sandy to clayey unconsolidated marine and fluvial deposits. These deposits are primarily sand and clay from the ocean and rivers that have been laid down over many thousands of years. They are called unconsolidated because they have not hardened into large beds of rock.
An aquitard, or confining layer, exists approximately 6 to 30 feet below most North Carolina Coastal Plain soils. This aquitard restricts the movement of groundwater downward and lateral flow of shallow, unconfined groundwater contributes approximately 70% of the stream flow in this region. As a consequence, nitrate that enters the groundwater in the Coastal Plain can become part of the surface water pollution problem.
The Coastal Plain can be divided into distinct regions: the Lower Coastal Plain; the Tidewater and Barrier Island regions, which are subdivisions of the Lower Coastal Plain; the Middle Coastal Plain; and the Upper Coastal Plain. The Upper Coastal Plain grades into the Piedmont just east of Raleigh.
Lower Coastal Plain and Tidewater Region
Lower Coastal Plain
The Lower Coastal Plain is a wide, flat plain that extends from the Atlantic Ocean west to the Goldsboro area. The many slow-moving streams in this area indicate that the water table is high and the soils are generally poorly drained. Large areas of poorly to very poorly drained soils exist in this region. These poorly drained soils are on flood plains directly adjacent to streams and also occur far away from the stream in the middle of the interfluve areas. Figure 11 illustrates the relationship between landscape position and water table depth. Soils are often more than 5 feet thick, but many have poorly defined loamy and clayey B horizons. Soils that are more shallow frequently have sandy C horizons.
Tidewater Region
The Tidewater region, in the northeast portion of North Carolina, is a part of the Lower Coastal Plain. The Barrier Island region occurs along the entire coast of North Carolina. The Tidewater region has distinctively broad, rolling plains separated by widely spaced streams and estuaries.
- The soils in both regions are more shallow than the rest of the Lower Coastal Plain and are usually about 3 to 4 feet in depth.
- Tidewater region soils tend to be poorly to very poorly drained, although well and moderately well-drained soils can be found along the dissected edges of the flats and slopes leading down to the estuaries and streams.
- Large wet areas are found inland between estuaries and streams in both regions. In general, the farther from the stream, the wetter the soil and the thicker the organic matter in the surface soil.
- Many soils in these regions are classified as organic soils.
Recommended Practices in the Lower Coastal Plain to Control Nonpoint Source Pollution
The poorly drained soils in the Lower Coastal Plain and Tidewater regions that have improved drainage systems are the most productive soils in the state for grain crops and several types of vegetables. This productivity is enhanced when controlled drainage is used. It is not practical for farmers to attempt to intercept subsurface flow from fields by placing riparian buffers next to the regularly spaced ditches or buried pipes present in this region. Because of the very flat topography, erosion is generally not a problem, since surface runoff water usually moves slowly and only small amounts of sediment are generally lost to surface waters (Skaggs et al., 1980).
Producers have installed over 3,000 controlled drainage structures that drain approximately 600,000 agricultural and forested acres in the Lower Coastal Plain of North Carolina. These structures both increase yield and reduce nitrogen losses to surface water by 40 to 50%. Because controlled drainage is effective in reducing nitrogen, it is recommended that producers in the Lower Coastal Plain utilize controlled drainage in conjunction with nutrient management to reduce nitrogen losses from agricultural fields. Even though controlled drainage has been generally accepted by producers, is cost shared by the state, and recommended by both the Natural Resource Conservation Service and the North Carolina Cooperative Extension Service, there are still large areas that could benefit from controlled drainage.
In conjunction with controlled drainage, all field ditches should have 3- to 6-foot riparian buffers, composed of grass or natural herbaceous vegetation, on both sides of the ditch. The general guide for width determination is that the width of the vegetated buffer on each side of the ditch should equal or exceed the ditch depth. Field borders on ditches are important to maintain the ditch structure and provide some reduction in sediment and nutrients derived from surface flow. Routine mowing or use of herbicides to selectively manage woody vegetation, along with sediment removal from the ditch and buffer, are acceptable recommended maintenance practices.
Controlled drainage is only effective for water quality if the water depth in the controlled drainage ditches is managed at the correct height, particularly during the winter (Figure 12). Evans et al. (1991) have prepared controlled drainage guidelines that are designed to both improve water quality and increase crop yields. We believe that these guidelines are very practical for most crop and soil situations when fields are fallow. These guidelines recommend setting the control structure at 12 to 18 inches below the soil surface during the winter. Holding the water table at 12 to 18 inches may cause problems in some situations (such as excessive ditch bank sloughing in fields with unstable sandy subsoil or excessively wet conditions during the winter growing season when wheat is planted). Thus, we are hesitant to recommend that it be required for water to be held at this height. Instead, we recommend that the control boards be placed and managed such that the average water elevation in the ditch throughout the length of the channel be no lower than 36 inches below the land. The height should be adequate to obtain credit for using controlled drainage for reducing nitrogen entry into surface water. Maintaining controlled water levels during the growing season does have some water quality benefits, but most benefits are obtained from December through March. While 36 inches below the land surface is the general recommendation, short-term adjustments (both higher and lower) are acceptable when necessary to accommodate routine production activities, such as tillage, planting, harvesting, and ditch maintenance, as well as abnormal weather conditions.
Because controlled drainage does not provide all of the aquatic benefits that riparian buffers do, we recommend that larger streams in the region still have riparian buffers. If this is done, anadromous fish can still migrate from the ocean into the streams. If controlled drainage is used in the fields, woody vegetation buffers adjacent to the large collector ditches are not expected to have any significant effect on nitrogen transported by the stream, but the overall heath of the stream would be better. This is because most nitrogen leaving agricultural fields originates from the headwater areas of streams and drainage ditches. If nitrogen enters surface water in the field ditches, riparian buffers along the larger stream will not help prevent its movement downstream. Natural streams that have been channelized should have woody vegetation adjacent to them whenever practical for the overall health of the stream.
Middle and Upper Coastal Plain
Middle Coastal Plain
The most critical area for nitrogen reduction from agricultural practices is the Middle and Upper Coastal Plain because this area contributes the most nitrogen per unit area of cultivated land and a high percentage of the area is in cultivated crops. On the average, an acre of farmland in this region contributes the most nitrogen to surface water because the soils are naturally better drained than those in the Lower Coastal Plain, resulting in transport through natural subsurface flow of residual nitrogen not utilized by crops. Most of the larger streams in the region are protected by riparian buffers, but much of the subsurface water from agricultural fields enters surface water through field ditches that were once natural drainageways. These natural drainageways have been channelized and the riparian vegetation removed to improve the hydraulic efficiency and reduce flooding. There is some reduction of nitrogen from the groundwater in the region of the ditch but not as much removal as occurs when the water passes below a riparian buffer.
The Middle Coastal Plain has smooth, gently rolling, plateau-like uplands that slope toward the ocean, and gentle-to-steep valley slopes. Figure 13 shows a typical land-scape for the Middle Coastal Plain.
- Many of the soils in this region have fine-loamy subsoils.
- Clayey soils are poorly drained over the entire region.
- For other soils, drainage is determined mainly by where the soil is located relative to streams and upland areas. For example, the high water tables in the middle of wide interfluves between streams result in poorly drained soils, but soils located at the edge of the uplands closer to the streams are well drained.
- Soils in the flood plains directly adjacent to the streams have variable water tables and are prone to flooding.
Figure 14 shows the relationship between landscape position, water table depth, and soil series in the Middle Coastal Plain.
Upper Coastal Plain
The Upper Coastal Plain is a transitional zone between the Coastal Plain and the Piedmont regions. The topography varies from flat areas to small hills.
- In this region, Coastal Plain sediments lie on top of Piedmont saprolite. These sediments are called Coastal Plain cappings. Saprolite is decomposed rock formed in place.
- The majority of the soils in the Upper Coastal Plain are well drained with B horizons formed in Coastal Plain cappings, merging into a 13- to 20-foot layer of saprolite.
- In places where the saprolite is exposed on the sideslopes, the soil patterns are very complicated, as shown in Figure 15. Typically, the thickest Coastal Plain cappings in the Upper Coastal Plain occur on the tops of hills and in the areas with the broadest interfluves.
Recommended Practices in the Middle and Upper Coastal Plain to Control Nonpoint Source Pollution
Even though this region loses more nitrogen to surface waters than other agricultural areas of the state, methods for reducing nitrogen inputs from agriculture in the Middle and Upper Coastal Plain are not as obvious as the techniques used in the Piedmont or Lower Coastal Plain. Many fields in the Middle and Upper Coastal Plain are flat, with inadequate natural drainage outlets for productive agriculture. Thus, irregularly spaced ditches have been placed in many fields and many of the natural streams have been channelized to increase flows. Field ditches, which are sufficiently shallow and collect primarily surface runoff, contribute only small amounts of nitrogen to streams and rivers. However, the deeper ditches, which intercept shallow subsurface flows, frequently have nitrate-nitrogen concentrations of 2 to 7 mg L-1. This is the primary mechanism for nitrogen entry into surface waters from agricultural fields in the Middle and Upper Coastal Plain. Because of the varied topography and soil types in the Middle and Upper Coastal Plain, nitrogen reductions from agricultural land will need to be achieved by nutrient management and a combination of riparian buffers, controlled drainage, and created in-stream wetlands, depending on the site locations.
As stated earlier, the most effective treatment for overall water quality is riparian buffers. However, there is tremendous opposition, with some justification, to putting riparian buffers adjacent to agricultural fields or channelized ditches. Alternatively, controlled drainage can be used to improve water quality, but because of the slopes in these regions little agricultural benefit will be realized from the controls. The greater the slopes in an area, the greater the cost per unit of treatment area when controlled drainage is used. Regardless of financial benefits, landowners must manage these controlled drainage structures to protect water quality. Without proper management, the structures will be ineffective. If given a choice, many farmers in this region may choose to pursue controlled drainage rather than have riparian buffers adjacent to their drainage ditches.
The ideal riparian buffer for Coastal Plain conditions would be the recommended 25 feet of forest plus the width of grass necessary to control erosion. However, the width of the buffers needed in the Middle and Upper Coastal Plain will generally not be as wide as those required between cultivated areas and streams in the Piedmont. Erosion is usually not as significant a problem in the Middle and Upper Coastal Plain as it is in the Piedmont; grass riparian buffers for sediment reduction are not required in most fields. A 25-foot forested riparian buffer will be adequate for significant (>30%) reduction in nitrate reaching the ditches (Figure 5).
Another riparian buffer type that can be used successfully in this region of North Carolina is a shrub buffer. Shrub buffers, which develop naturally in North Carolina when cleared areas are left undisturbed, can provide water quality benefits through the denitrification of nitrate (Figure 16). In addition, shrubby vegetation provides habitat for wildlife such as quail (Anderson, 1997). Using a mechanical system that cuts small wounds in trees and wipes the wound with herbicide, shrubs can be maintained and growth of undesirable tree species retarded.
Shrub riparian buffers can be maintained more cheaply than grass riparian buffers. Cost analyses demonstrate that maintaining shrub vegetation costs $13.00 per linear mile of ditch while custom mowing costs approximately $25.00 per linear mile (Anderson et al., 1996). The biggest drawback to the use of shrub riparian buffers is their appearance, which some producers find offensive.
The question continually asked is, “Can the same reduction in nitrate be achieved with a grass riparian buffer as with a forested riparian buffer?” There are insufficient data at this time to compare the function of both types of buffers. It is a “scientific best professional judgment” that woody plants work better in the Coastal Plain because of acidic subsoil. Grasses tend to be more sensitive to acidic conditions and it is believed that they are shallower rooted than woody vegetation under acidic soil conditions. Roots of deeply rooted woody vegetation are increasingly likely to interact with the groundwater that passes through the riparian buffer area. However, deep-rooted grasses, if they are acid tolerant, would probably work as well. Since there are no data at this time to support grass vegetation on the Coastal Plain, we recommend that riparian buffers designed to reduce nitrate be composed of woody herbaceous plants.
The primary factors involved in determining the appropriateness of controlled drainage or riparian buffers are slope and depth to groundwater table. In order to obtain water quality benefits from controlled drainage, the water table along the length of the drainage channel should be kept at least 36 inches or closer to the surface of the soil so that a saturated zone is established near the surface to promote denitrification (Figure 17). If the slope in the channel is greater than 0.2 or 0.3%, controlled drainage could be used, but the cost becomes prohibitive. On most of the soils within the Upper or Middle Coastal Plain, controlled drainage has little or no effect on crop yields, thus the benefits are strictly for the protection of water quality.
Deciding which BMPs should be combined to control nitrogen will generally need to be done on a site-by-site basis. In order to help determine what BMPs should be utilized, the decision tree presented below should be used. This decision tree represents best professional judgements. Because there is a lack of empirical evidence on the placement of created in-stream wetlands, site-specific recommendations are not being made for their installation.
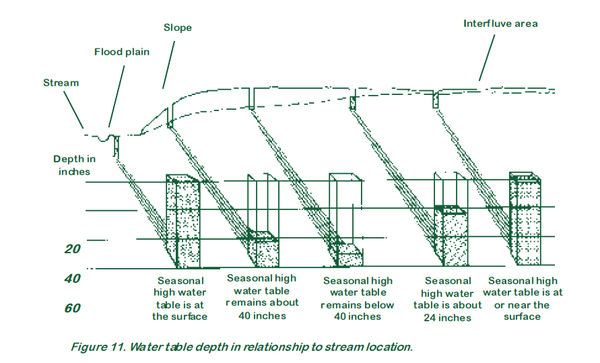
Figure 11. Water table depth in relationship to stream location.
Figure 12. Controlled drainage.
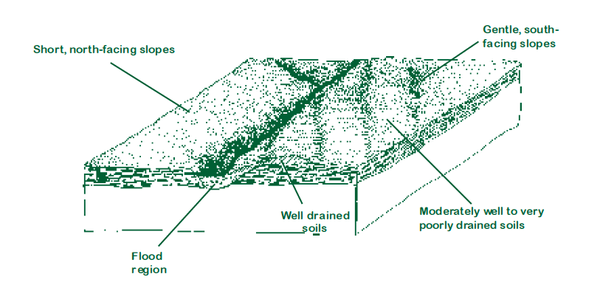
Figure 13. Landscape Middle Coastal Plain (from Daniels et al., 1984).
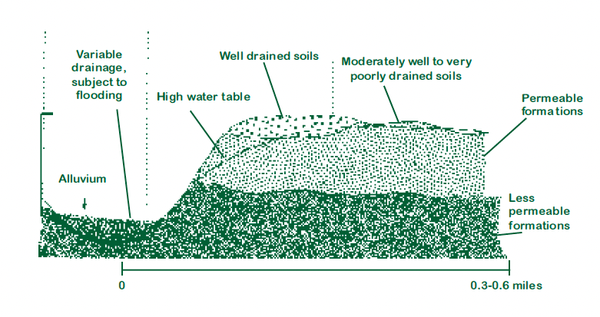
Figure 14. Relationship between landscape position, water table depth, and soil series in the Middle Coastal Plan (from Daniels et al., 1984).
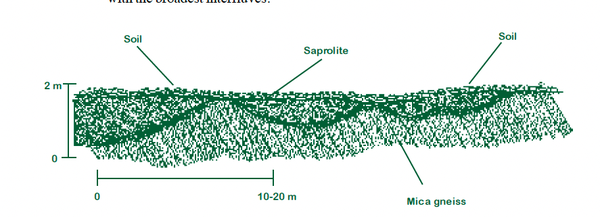
Figure 15. Relationship between soil and saprolite (from Daniels et al., 1984).
Figure 16. Shrub buffer.
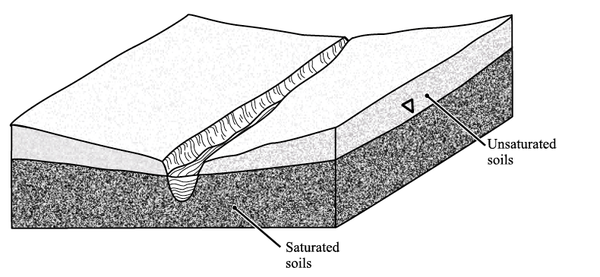
Figure 17. Depth of groundwater for effective nitrate control.
Decision Tree for Determining BMP Usage
Piedmont
The word Piedmont means foot of the mountain. Thus, the Piedmont region lies at the foot of the mountains, between the Mountain and Coastal Plain regions. The Piedmont covers 39% of North Carolina and has a rolling-to-hilly topography. Elevations in the Piedmont range from 295 feet to 1,509 feet. The geology of the Piedmont is very complex and, as a result, the soils are very complex. Eight geologic belts, composed of areas with similar rock types and geologic histories, exist in the Piedmont (Figure 18).
Recommended Practices in the Piedmont to Control Nonpoint Source Pollution
Because of the rolling topography of the Piedmont, nutrient management and riparian buffers are the most suitable BMPs to reduce nitrogen loading. The use of buffers, in conjunction with other BMPs (such as terraces, contour farming, conservation tillage, grassed waterways, field borders) should also be used to retard sediment and phosphorus. It should be noted that while these latter BMPs are very good conservation practices, they are inadequate alone for reducing nitrogen entry into surface waters. However, agricultural systems in the Piedmont are contributing the least amount of the nitrogen to streams and rivers because agricultural activities are much less intense in the Piedmont than agricultural production in the Coastal Plain. In addition, subsurface drainage water from most agricultural fields in the Piedmont is currently passing through riparian buffers. Thus implementation of additional measures in the Piedmont to improve nutrient water quality problems should have low priority. However, sediment entry into surface waters in the Piedmont region is of considerable concern; buffers should be continued and maintained.
Riparian Buffers
To reduce nitrogen, retard sediment and phosphorus, and protect stream integrity on cultivated fields, 50-foot buffers are recommended. These buffers should consist of 25 feet of grass and 25 feet of forest, with the forested area being adjacent to the stream (Figure 19). The 50-foot buffer will generally be required in the Piedmont whereas a 25-foot buffer will sometimes be adequate in the Coastal Plain. Because Piedmont soils are generally steeper and have a higher clay content in the surface horizon, there is more surface runoff and potentially higher erosion rates associated with these soils. Thus, a combination of grass and forested riparian buffer is generally recommended. However, practices such as conservation tillage can greatly increase infiltration and reduce surface runoff. In situations where a 50-foot buffer would cause a significant loss of tillable land (the authors have seen few examples in the Piedmont where this would be the situation), a 25-foot forested riparian buffer, used in conjunction with conservation tillage, would likely prove adequate to protect surface waters from sediment.
Because of the rolling topography of the Piedmont, runoff may form channels that cut through riparian buffers, thus reducing their effectiveness in controlling sediment and sediment-associated pollutants, such as phosphorus. Particularly in the Piedmont, but in any location where sediment loss is a problem, grass riparian buffers must be maintained. This will generally mean that they must be reworked every three to eight years and that the sediment that has been deposited in or just in front of the buffer must be redistributed. Unmaintained grass riparian buffers will almost always become ineffective.
Level Spreader
A level spreader spreads the incoming water across the length of the buffer, thus reducing the water velocity and improving the performance of the buffer.
Level spreaders are outlets for concentrated runoff and are constructed to laterally disperse discharge uniformly across a slope. A level spreader consists of a long, narrow trench, and is often used to disperse runoff from a diversion (Figure 20). The outlet lip must be of uniform elevation and should be constructed in stable, undisturbed soil. The outlet area should have a uniform slope and be well vegetated to avoid rechanneling flows (Franklin et al., 1992).
Level spreaders improve water quality by reducing runoff discharge peaks and enhancing sediment and nutrient removal efficiency of riparian buffers (Figure 21). By converting concentrated, erosive flow to diffuse sheet flow, the level spreader stabilizes slopes, better approximates pre-development hydrology of receiving systems, and provides opportunity for greater infiltration, phosphorus removal, and denitrification in the associated filtering down slope (Gannon et al., 1995).
Level spreaders are almost always used in combination with other BMPs. Consequently, no evaluation of the effectiveness of spreaders themselves was found, and little attention has been given to their ability to improve the function of associated BMPs. However, Franklin et al. (1992) routed runoff from two no-till wheat fields into level spreaders above forested riparian buffers in the Piedmont of North Carolina.
Over a 3- and 10-month period, they measured 6 to 8% reductions in the total surface discharge-to-rainfall ratios and 36% drops in peak discharge rates through the level spreader system. They also found proportional reductions of 75% ammonia, 29%Kjeldahl nitrogen, 17% nitrate, 38% ortho-phosphorus, 32% total phosphorus, and 47% total suspended solids through the level spreader riparian buffer system. At the same experiment sites, Verchot et al. (1995) found enhanced denitrification potential in the riparian buffer soils downgradient from the level spreaders as compared to the potential in soils just outside the level spreader zone.
Level spreaders should be inspected and repaired, if necessary, after every rainfall until vegetation is established. Runoff containing high sediment loads should be treated in a sediment-trapping device before release into a level spreader.
Pastures
In the Piedmont, on well maintained, low-maintenance pastures that generate little sediment and phosphorus losses, smaller riparian buffer widths may be considered. One line of trees or a 15-foot forested riparian buffer will adequately reduce nitrate-nitrogen levels (Figure 22). However, to retard phosphorus losses, a 30-foot buffer may be more appropriate. Unless grazing animals are fenced out of the riparian buffer, cattle trodding will continue to degrade or destroy fish habitat. In addition, reduced shading, because of the narrower forest width, will increase stream temperatures and diminish food sources (detritus), thus ultimately reducing aquatic habitat and aquatic organisms.
Mountains
The mountain region covers 16% of the area of North Carolina. Elevations range from 1,509 feet to the tallest peak, Mt. Mitchell, at 6,693 feet. The soils in the Mountain region can be divided into three broad classes: soils found on sharp mountain ridges and steep valley slopes; soils in broad basins with low rounded ridges, river terraces, and flood plains; and soils on high mountain peaks and ridges. Soil properties depend mostly on parent material and landscape position (Figure 23). The major agricultural regions are found in the intermountain basin soils that form in the broad basins, river terraces, and flood plains between large mountain chains. These are broad, relatively flat basins. Local relief in this area of the Mountains is much less than in the other regions.
Recommended Practices in the Mountains to Control Nonpoint Source Pollution
Most of the riparian buffer work in controlling NPS pollution has been conducted in the other physiographic regions. Because topographic characteristics of the mountain regions are different, the nonpoint source pollutants vary. Smaller, higher elevation streams are more susceptible to sediment and temperature pollution (high temperatures). Streams and rivers with arable flood plains would encounter more nutrient pollution.
Recent research was conducted by USEPA on a tributary of the Little Tennessee River. Cattle were fenced out of the stream with a 40-foot riparian buffer and cattle crossing across the stream. Preliminary data showed a 90% reduction in nitrate-nitrogen, 40%in fecal coliform and sediment (Vose, personal communication). Other researchers in Pennsylvania demonstrated the ability of a riparian buffer to denitrify nitrogen in mountainous regions (Flite et al., 2001). The predominant vegetative type was eastern hemlock with few herbaceous species in the buffer strip. Researchers measured nitrate-nitrogen reductions from 12 mg L-1 at the field edge to less than 0.5 mg L-1 at the stream edge (Flite et al., 2001).
Buffer widths and types will vary in the mountains depending on the landscape. On flat floodplain regions where erosion is not a problem, 25-foot buffers may suffice. However, as the topography starts to include sloping lands, a minimum of a 50-foot buffer (25 feet trees and 25 feet grass) would be recommended. In some cases, on steeply sloping land, buffers may need to be wider.
In the Mountains, on well-maintained, low-maintenance pastures that generate little sediment and phosphorus losses, smaller riparian buffer widths may be considered. One line of trees or a 15-foot forested riparian buffer will adequately reduce nitrate-nitrogen levels (Figure 22). However, to retard phosphorus losses, a 30-foot buffer may be more appropriate. Unless grazing animals are fenced out of the riparian buffer, cattle trodding will continue to degrade or destroy fish habitat. In addition, reduced shading, because of the narrower forest width, will increase stream temperatures and diminish food sources (detritus), thus ultimately reducing aquatic habitat and aquatic organisms.
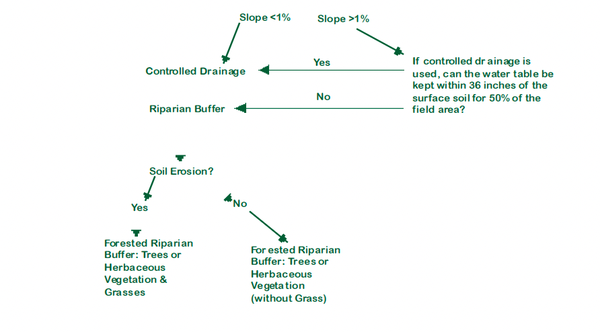
Decision Tree for Determining BMP Usage
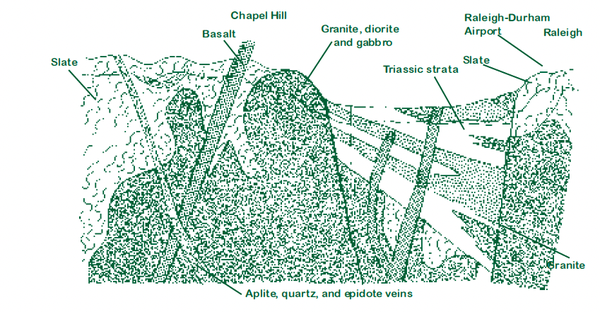
Figure 18. Mineralogy from Chapel Hill to Raleigh (from Daniels et al., 1984).
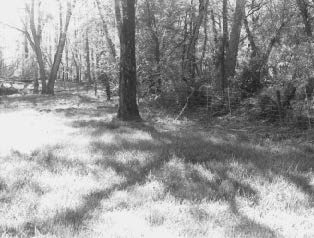
Figure 19. Recommended riparian buf fer.
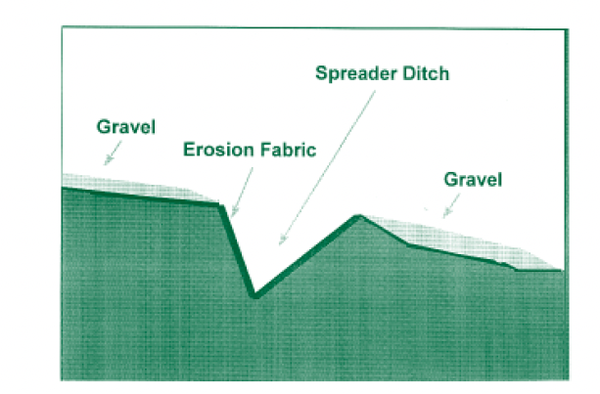
Figure 20. Detailed cross-section of level spreader trench f or dispersing runoff along the contour.
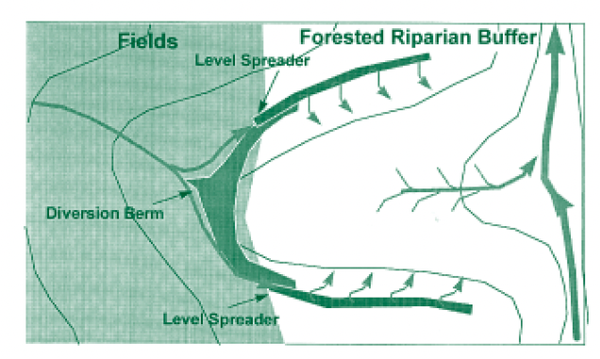
Figure 21. Design of level spreader used for dispersing agricultural runoff through a forested riparian buffer.
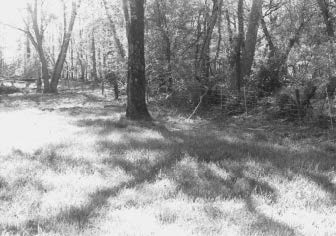
Figure 22. Pasture stream with fenced riparian buf fer.
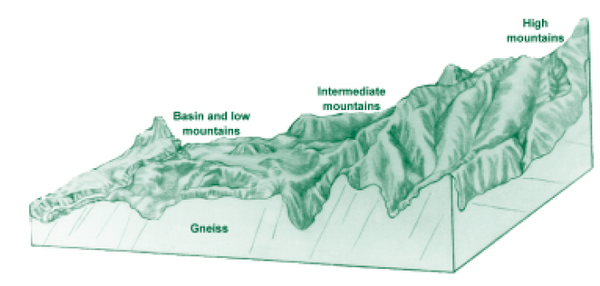
Figure 23. The mountain region of North Carolina and the three regional divisions (Daniels et al., 1984)
Glossary
Algae — Any of various primitive, chiefly aquatic, one- or multi-celled, nonflowering plants that lack true stems, roots, and leaves, but usually contain chlorophyll. Algae convert carbon dioxide and inorganic nutrients, such as nitrogen and phosphorus, into organic matter through photosynthesis and form the basis of the marine food chain. Common algae include dinoflagellates, diatoms, seaweeds, and kelp.
Algal bloom — A condition which occurs when excessive nutrient levels and other physical and chemical conditions facilitate rapid growth of algae. Algal blooms may cause changes in water color. The decay of the algal bloom may reduce dissolved oxygen levels in the water.
Anadromous — Migrating upstream to freshwater streams to spawn.
Anaerobic — Any process that can occur without molecular oxygen; also applicable to organisms that can survive without free oxygen.
Aquatic — Living in the water.
Aquifer — A subsurface water-bearing layer that will yield water in a usable quantity to a well or spring.
Aquitard — A subsurface semi-confining layer that can store ground water and also transmit it slowly from one aquifer to another.
Bankfull height — The flow in a stream that just fills the stream channel to the top of its banks and the point where the water begins to overflow onto a flood plain.
Bedload — Sediment or other material that slides, rolls, or bounces along the streambed or channel bed of flowing water.
Beneficial use — The uses of a water resource that are protected by state laws called water quality standards. Uses include aquatic life, recreation, human consumption, and fish or wildlife habitat.
Benthic — Living in or on the bottom of a body of water.
Benthos — Collectively, all organisms living in, on, or near the bottom substrate in aquatic habitats (examples are oysters, clams, burrowing worms).
Best management practices (BMPs) — Management practices (such as nutrient management) or structural practices (such as terraces) designed to reduce the quantities of pollutants — such as sediment, nitrogen, phosphorus, and animal wastes — that are washed by rain and snow melt from farms into nearby receiving waters, such as lakes, creeks, streams, rivers, estuaries, and ground water.
BMP — See Best management practices.
BMP system — A combination of individual BMPs into a “system” that functions to reduce the same pollutant.
Coliform bacteria — See Fecal coliform bacteria.
Conservation tillage — Any tillage and planting system that maintains at least 30%of the soil surface covered by residue after planting for the purpose of reducing soil erosion by water.
Contaminant — See Pollutant.
Contour — An imaginary line on the surface of the earth connecting points of the same elevation. A line drawn on a map connecting points of the same elevation.
Controlled drainage — The use of surface and subsurface drainage and control structures to control the water table depth in a field.
Denitrification — The process by which nitrate-nitrogen is converted to nitrogen gas by soil microorganisms when soil oxygen is low or absent.
Deposition — The settling out of a soil particle or aggregate of particles from the water column.
Designated use — A beneficial use type established by a state for each water resource and specified in water quality standards, whether or not it is being attained.
Detachment — The process of a soil particle, nutrient, or pesticide breaking free from its position in the soil.
Detritus — Fragments of plant material.
Diatoms — Any number of microscopic algae whose cell walls consist of two box-like parts or valves and contain silica.
Dinoflagellates — Unicellular biflagellate algae with thick cellulose plates.
Dissolved oxygen — The amount of oxygen present in the water column. More than 5 parts oxygen per million parts water is considered healthy; below 3 parts oxygen per million is generally stressful to aquatic organisms.
Drainage area — An area of land that drains to one point; watershed.
Drainage ditch — A ditch that is constructed in a field in order to allow agricultural fields to drain more quickly.
Erosion — Wearing away of rock or soil by the gradual detachment of soil or rock fragments by water, wind, ice, and other mechanical, chemical, or biological forces.
Estuary — A coastal water resource where fresh water from rivers mixes with salt water from the ocean.
Eutrophic — Usually refers to a nutrient-enriched, highly productive body of water.
Eutrophication — A process by which a water body becomes rich in dissolved nutrients, often leading to algal blooms, low dissolved oxygen, and changes in community composition. Eutrophication occurs naturally, but can be accelerated by human activities that increase nutrient inputs to the water body.
Fecal coliform — Bacteria from the colons of warm-blooded animals which are released in fecal material.
Flagellum — A long, thread-like organelle used by many microscopic organisms for locomotion and feeding.
Flashboard riser control structure — A structure made of corrugated steel that, when installed in a drainage ditch, allows the water level in the ditch to be controlled by the addition or removal of wooden boards.
Forested riparian buffer — Streamside forest that is used to control nonpoint source pollution and in particular, sediment and nutrients.
Ground water — The water that occurs beneath the earth’s surface between saturated soil and rock and that supplies wells and springs.
Herbicide — A substance used to destroy or inhibit the growth of vegetation.
Impaired waters — Surface and ground waters that are negatively impacted by pollution resulting in decreased water quality.
Integrated pest management (IPM) — A systems approach that combines a wide array of crop production practices with careful monitoring of pests and their natural enemies. IPM practices include use of resistant varieties, timing of planting, cultivation, biological controls, and judicious use of pesticides to control pests. These IPM practices are used in greenhouses and on field crops. IPM systems anticipate and prevent pests from reaching economically damaging levels.
Interfluve — The area between two adjacent streams flowing in the same direction.
Intermittent stream — A watercourse that flows only at certain times of the year, conveying water from springs or surface sources; also, a watercourse that does not flow continuously when water losses from evaporation or seepage exceed available stream flow.
Isopod — Aquatic crustacean with a flat, oval body and seven pairs of walking legs of similar size and form, each pair attached to the thorax.
Lake — A man-made impoundment or natural body of fresh water of considerable size, whose open-water and deep-bottom zones (no light penetration to bottom) are large compared to the shallow-water (shoreline) zone, which has light penetration to its bottom.
Land treatment — The whole range of BMPs implemented to control or reduce nonpoint source pollution.
Land use — The way land is developed and used in terms of the types of activities allowed (agriculture, residences, industries, etc.) and the size of buildings and structures permitted. Certain types of pollution problems are often associated with particular land uses, such as sedimentation from construction activities.
Loading — The influx of pollutants to a particular water body.
Macroinvertebrate — Any nonvertebrate organism that is large enough to be seen without the aid of a microscope.
Management BMPs — BMPs that primarily involve a change in management practices, such as changing the timing, method, and/or amount of the application of a potential pollutant in order to reduce the chance that it will contaminate water resources.
Mineralization — The conversion of humus and soil organic matter into inorganic substances by microbial breakdown.
Neurotoxin — A poisonous compound that acts on the nervous system.
Nitrate — A form of nitrogen which is readily available to both aquatic and terrestrial plants as a nutrient.
Nitrification — The oxidation of ammonia to nitrate and nitrite, yielding energy for decomposing organisms.
Nitrogen — An element that is a component of protein structures in living organisms.
No-till — The practice of leaving the soil undisturbed from harvest to planting except for nutrient injection. Planting or drilling is accomplished in a narrow seedbed or slot created by coulters, row cleaners, disk openers, in-row chisels, or rototillers. Weed control is accomplished primarily with herbicides.
Nonpoint source controls — General phrase used to refer to all methods employed to control or reduce nonpoint source pollution.
Nonpoint source pollution — Pollution originating from runoff from diffuse areas
(land surface or atmosphere) having no well-defined source.
Nutrient management — A BMP designed to minimize the contamination of surface and ground water by limiting the amount of nutrients (usually nitrogen) applied to the soil to no more than the crop is expected to use. This may involve changing fertilizer application techniques, placement, rate, or timing. The term fertilizer includes both commercial fertilizers and manure.
Nutrients — Chemicals that are needed by plants and animals for growth (e.g., nitro-gen, phosphorus). In water resources, if other physical and chemical conditions are optimal, excessive amounts of nutrients can lead to degradation of water quality by promoting excessive growth, accumulation, and subsequent decay of plants, especially algae. Some nutrients can be toxic to animals at high concentrations.
Parts per million (ppm) — A volume unit of measurement; the number of parts of a substance in a million parts of another substance. For example, 10 ppm nitrate in water means 10 parts of nitrate in a million parts of water.
Perennial stream — A watercourse that flows throughout the year or most of the year (90%), in a well defined channel. Same as a live stream.
Pesticide — Any substance that is intended to prevent, destroy, repel, or mitigate any pest.
Pesticide management — A BMP designed to minimize contamination of soil, water, air, and nontarget organisms by controlling the amount, type, placement, method, and timing of pesticide application necessary for crop production.
pH — The negative log of the hydrogen ion concentration. A measure of the acidity or alkalinity of a solution.
Phosphorus — An element essential to the growth and development of plants, but which, in excess, can cause unhealthy conditions that threaten aquatic animals in surface waters.
Point source — Any confined and discrete conveyance from which pollutants are or may be discharged. These include pipes, ditches, channels, tunnels, conduits, wells, containers, and concentrated animal feeding operations.
Point source pollution — Water pollution that is discharged from a discrete location such as a pipe, tank, pit, or ditch.
Pollutant — A contaminant that adversely alters the physical, chemical, or biological properties of the environment. The term includes nutrients, sediment, pathogens, toxic metals, carcinogens, oxygen-demanding materials, and all other harmful substances. With reference to nonpoint sources, the term is sometimes used to apply to contaminants released in low concentrations from many activities which collectively degrade water quality. As defined in the federal Clean Water Act, pollutant means dredged spoil, solid waste, incinerator residue, sewage, garbage, sewage sludge, munitions, chemical wastes, biological materials, radioactive materials, heat, wrecked or discarded equipment, rock, sand, cellar dirt, and industrial, municipal, and agricultural waste discharged into water.
Reduction — Gain of an electron by an atom, ion, or molecule; a decrease in the oxidation state.
Riffles — Areas of a stream or river characterized by a rocky substrate and turbulent, fast-moving, shallow water.
Riparian — Relating to the bank or shoreline of a body of water.
River — A watercourse that flows at all times, receiving ground or surface water, for example, from other streams or rivers. The terms “river” and “stream” are often used interchangeably, depending on the size of the water resources and the region in which they are located.
Runoff — Water that is not absorbed by soil but rather drains off the land into bodies of water, either via surface or subsurface flows.
Sediment — Particles and/or clumps of particles of sand, clay, silt, and plant or animal matter carried in water.
Sedimentary rock — A type of rock formed by chemical precipitation or by sedimentation and cementation of mineral grains transported to a site of deposition by water, wind, or ice.
Sedimentation — Deposition of sediment.
Source control — A practice, method, or technology used to reduce pollution from a source such as best management practices or end-of-pipe treatment.
Structural BMPs — BMPs that require the construction or use of a structure such as a terrace, lagoon, or waste storage facility.
Subbasins — One of several basins that form a watershed.
Subirrigation — Utilization of subsurface drainage to irrigate crops through the use of capillary rise of water from the full drainage tiles upward through the soil into the rooting zone.
Subsurface drainage — The use of tiles or plastic tubing that is buried 3 to 5 feet deep at a spacing of 50 to 200 feet to drain the soil.
Subwatershed — A drainage area within a watershed.
Surface drainage — The use of open ditches that provide predominately surface drainage.
Suspended load — Sediment that is transported by suspension in the water column of a stream or river.
Suspended solids — Organic and inorganic particles, such as solids from wastewater, sand, clay, and mud, that are suspended and carried in water.
Targeting — The process of prioritizing pollutant sources for treatment with BMPs or a specific BMP to maximize the water quality benefits of the implemented BMPs.
Total Kjeldahl nitrogen (TKN) — An oxidative procedure that converts organic nitro-gen forms to ammonia by digestion with an acid, catalyst, and heat.
Total suspended solids (TSS) — The weight of particles that are suspended in water. Suspended solids in water reduce light penetration in the water column, can clog the gills of fish and invertebrates, and are often associated with toxic contaminants because organics and metals tend to bind to particles. Total suspended solids are differentiated from total dissolved solids by a standardized filtration process, the dissolved portion passing through the filter.
Transport — The movement of a soil particle, nutrient, or pesticide from its original position. This movement may occur in water or air currents. Nutrients and pesticides can be transported to soil particles or dissolved in water.
Tributary — A stream or river that flows into a larger stream or river.
Turbidity — A measure of the amount of light intercepted by a given volume of water due to the presence of suspended and dissolved matter and microscopic biota. Increasing the turbidity of the water decreases the amount of light that penetrates the water column. High levels of turbidity are harmful to aquatic life.
Unsaturated flow — Underground water flow through soil or rock where the void spaces are filled both with water and air.
Vegetative filter strips — A strip or area of vegetation for removing sediment, organic matter, and other pollutants from runoff and wastewater.
Volatilization — The transport of a liquid substance by vaporization.
Water management — The practice of limiting the amount of water used in activities such as animal waste flushing systems or milking operations in order to reduce the amount of runoff and, therefore, decrease the probability of polluting nearby surface water.
Water quality standards — Established limits of certain chemical, physical, and biological parameters in a water body; water quality standards are established for the different designated uses of a water body.
Water table — The depth or level below which the ground is saturated with water.
Water table management — Control of the shallow ground water table through a combination of surface drainage, controlled drainage, or subirrigation.
Water table management systems — The practices of surface drainage, controlled drainage, or subirrigation that are used in combination to control water table depth. Used in conjunction, these practices can increase yield and decrease nutrient pollution.
Watershed — The area of land from which rainfall (and/or snow melt) drains into a single point. Watersheds are also sometimes referred to as drainage basins or drainage areas. Ridges of higher ground generally form the boundaries between watersheds. At these boundaries, rain falling on one side flows toward the low point of one watershed, while rain falling on the other side of the boundary flows toward the low point of a different watershed.
Wetland construction — A subset of wetland creation; creation of wetlands specifically for water quality improvement purposes, typically involving controlled outflow and a design that maximizes selected treatment functions. Creation of an engineered system to simulate the water purification function of natural wetlands for human use and benefits.
Wetland creation — The bringing into existence of a wetland, whether by accident or intentionally, where none existed previously, for purposes including mitigation, habitat provision, and water quality improvement.
Wetland enhancement — Modification of a natural or created wetland to enhance one or more functions, typically to the detriment of other functions.
Wetland restoration — Rehabilitation of previously existing wetland functions, from a more impaired to a less impaired or unimpaired state of overall function.
Wetlands — Areas that are inundated or saturated by surface or ground water at a frequency and duration sufficient to support, and that under normal circumstances do support, a prevalence of vegetation typically adapted for life in saturated soil conditions. Wetlands generally include swamps, marshes, bogs, and similar areas (40 CFR 232.2(r)).
References
Anderson, J.R. 1997. Bringing back the Bobwhite Quail. Quail Unlimited, Jan.-Feb., 1997. ↵
Anderson, J.R., P.T. Bromley, B.E. Warson, and W.E. Palmer. 1996. Vegetation Management with the Weed SweepÒ. North Carolina Cooperative Extension, North Carolina State University, Raleigh, NC. ↵
Brinson. M.M. 1993. Changes in the functioning of wetlands along environmental gradients. Wetlands 13(2):65-74. ↵
Call, D.J., L.T. Brooke, R.J. Kent, S.H. Poirer, M.L. Knuth, P.J. Shobat, and E.J. Slick. 1984. Toxicity, uptake, and elimination of the herbicides alachlor and dinoseb in freshwater fish. J. Environ. Qual. 13:493-498. ↵
Clark, E. H. II, J.A. Haverkamp, and W. Chapman. 1985. Eroding Soils: The Off-farm Impacts. The Conservation Foundation, Washington, DC. 252p. ↵
Cooper, J.R. and J.W. Gilliam.1987. Phosphorus redistribution from cultivated fields into riparian areas. Soil Sci. Soc. Am. J. 51; 1600- 1604. ↵
Correll, D.L., T.E. Jordan, and D.E. Weller. 1994. Failure of agricultural riparian buffers to protect surface waters from groundwater contamination. In press. In: Groundwater–Surface Water Ecotones. Lyon, France. July, 1993 UNESCO/MAB/ IHP. J. Gibert (ed.). Cambridge Univ. London Press. ↵
Correll, D.L. and D.E. Weller. 1989. Factors limiting processes in freshwater wetlands: An agricultural primary stream riparian forest. Pages 9-23. In: Freshwater Wetlands and Wildlife. R.R. Sharitz and J. W. Gibbons (eds). Oak Ridge, U.S. Dept. of Energy. ↵
Crance J.H. 1988. Relationships between Palustrine Wetlands of Forested Riparian Floodplains and Fishery Resources: A Review. U.S. Fish Wildl. Serv. Biol. Rep. 88(32). 27 pp. ↵
Daniels, R.B., H.J. Kleiss, S.W. Buol, H.J. Byrd, and J.A. Phillips. 1984. Soils Systems in North Carolina. North Carolina Agricultural Research Service, North Carolina State University, Raleigh, NC.
Deal, S.C., J.W. Gilliam, R.W. Skaggs, and K.D. Konyha. 1986. Prediction of nitrogen and phosphorus losses as related to agricultural drainage system design. Agriculture Ecosys & Environ. 18:37-51. ↵
Dillaha, T.A., J.H. Sherrard, and D. Lee. 1989. Long-term ef fectiveness of vegetative filter strips. Water Environ. Soc. 1:419-421. ↵
Dingman, S.L. 1994. Physical Hydrology. Prenctice Hall, NJ. 575 pp. ↵
Doty, C.W., J.W. Gilliam, and J.E. Parsons. 1986. Stream Water Level Control Affects Irrigation Water Supply and Quality. American Society of Agricultural Engineers. ASAE Paper 86-2581. ↵
Evans, R.O., J.W. Gilliam, and R.W. Skaggs. 1991. Controlled Drainage Management Guidelines for Improving Water Quality. AG-443. N. C. Agricultural Extension Service, Raleigh, NC. 16 p. ↵
Evans, R.O., J.W. Gilliam, and R.W. Skaggs. 1989. Effects of Agricultural Water Table Management on Drainage Water Quality. Water Resources Research Institute of The University of North Carolina, Report no. 237. Raleigh, NC. 87 p. ↵
Evans, R.O., J.W. Gilliam, R.W. Skaggs, and W.L. Lemke. 1987. Effects of agricultural water management on drainage water quality. pp. 210-219. In: Drainage Design and Management. Fifth National Drainage Symposium. Am. Soc. Ag. Eng., Dec. 14-15, Chicago, Ill. ↵
Fail, J.L., B.L. Haines, and R.L. Todd (1986) Riparian forest communities and their role in nutrient conservation in an agricultural watershed. Amer. J. Alternative Agriculture II(3); 114-121. ↵
Flite, O.P.,IIII, R.D. Shannon, R.R. Schnabel, and R.R. Parizek. 2001. Nitrate removal in a riparian wetland of the Appalachian Valley and Ridge Phisographic Province. J. Env. Qual. 30:254-261. ↵
Franklin, E.C., J.D. Gregory, and M.D. Smolen. 1992. Enhancement of the Effectiveness of Forested Filter Zones by Dispersion of Agricultural Runoff. Water Resources Research Institute of The University of North Carolina, UNC-WRRI-92-270, Raleigh, NC. ↵
Gannon, R., D.L. Osmond, S.W. Coffey, and F.J. Humenik. 1995. Development of National Nonpoint Source Management Practices: Guidance to Meet Requirements of a Reauthorized Clean Water Act. USEPA Contract #68-C3-0303, NCSU Water Quality Group Work Assignment #1-79, Task 4. Department of Biological and Agricultural Engineering, North Carolina State University, Raleigh, NC. ↵
Gilliam, J.W. 1994. Riparian wetlands and water quality. J.Environ. Qual. 28:896-900. ↵
Gilliam, J.W., J.E. Parsons, and R.L. Mikkelsen. 1997. Nitrogen dynamics and buffer zones. pp. 54-61. In: Haycock, N.E., T.P. Burt, K.W.T. Goulding, and G. Piney (ed.). Buffer Zones: Their Processes and Potential and Water Protection. Quest Environmental, Harpenden Herts. U.K. ↵
Gilliam, J.W., R.W. Skaggs, and S.B. Weed. 1979. Drainage control to reduce nitrate loss form agricultural fields. J. Environ. Qual. 8:137-142. ↵
Gilliam, J.W., R.W. Skaggs, and S.B. Weed. 1978. An Evaluation of the Potential for Using Drainage Control to Reduce Nitrate Loss Form Agricultural Fields to Surface Waters. Water Resources Research Institute of The University of North Carolina, Report no. 128. Raleigh, NC. 108 p. ↵
Goodrich, J.A., B.W. Lykins, Jr., and Robert M. Clark. 1991. Drinking water from agriculturally contaminated ground water. J. Environ. Qual . 20:707-717. ↵
Groffman, P.M. E.A. Axelrod, J.L. Lemunyon, and W.M. Sullivan. 1991. Denitrification in grass and forest vegetated filter strips. J. Environ. Qual. 20:671- 674. ↵
Hammer, D.A. 1992. Designing constructed wetlands systems to treat agricultural nonpoint source pollution. Ecological Engineering 1:49-82. ↵
Haycock, N.E. and G. Pinay. 1993. Groundwater nitrate dynamics in grass and poplar vegetated riparian buf fer strips during the winter. J. Environ. Qual. 22:273-278. ↵
Hickman, J., J. Jacobsen, and D. Lyon. 1994. Best Management Practices for Wheat. Cooperative Extension System and The National Association of Wheat Growers Foundation, Washington, DC. ↵
Hill, A.R. 1996. Nitrate removal in stream riparian zones. J. Environ. Qual. 25:743- 755. ↵
Jacobs, T.C. and J.W. Gilliam. 1985. Riparian losses of nitrate from agricultural drainage waters. J. Environ. Qual. 14:472-478. ↵
Jordan, T.E., D.L. Correl, and D.E. Weller. 1993. Nutrient interception by a riparian forest receiving inputs from cropland. J. Environ. Qual. 22:467-473.
Kent, D.M. 1994. Designing Wetlands for Wildlife. Chapter 13 In: Applied Wetlands Science and Technology. D.M. Kent (ed). CRC Press: Boca Raton, FL. ↵
Kunickis, S.H. 2000. The Effect of Riparian Buffers with Controlled Drainage on Soil Redox Potential. Thesis (PhD). NC State University, Raleigh, NC. ↵
Line, D.L and J. Spooner. 1995. Critical Areas in Agricultural Nonpoint Source Pollution Control Projects:The Rural Clean Water Program Experience. Fact Sheet no. 5. NCSU Water Quality Group, North Carolina State University, Raleigh, NC. ↵
Lowrance, R. 1992. Groundwater nitrate and denitrification in a Coastal Plain riparian forest. J. Environ. Qual. 21:401-405. ↵
Lowrance, R., L.S. Altier, J.D. Newbold, R.R. Schnabel, P.M. Groffman, J.M. Denver, D.L. Correll, J.W. Gilliam, J.L. Robinson, R.B. Brinsfield, K.W. Staver, W. Lucas, and A.H. Todd. 1995. Water Quality Functions of Riparian Forest Buffer Systems in the Chesapeake Bay Watershed. U.S. Environmental Protection Agency, Washington, DC. EPA 903-R-95-004/CBP/TRS 134/95. ↵
Lowrance, R., R. Leonard, and J. Sheridan. 1985. Managing riparian ecosystems to control nonpoint pollution. J. Soil & Water Conserv. 40:87-97. ↵
Lowrance, R.R., R.L. Todd, and L.E. Asmussen. 1983. Waterborne nutrient budgets for the riparian zone of anagricultural watershed. Agriculture Ecosyst. Environ. 10; 371-384. ↵
McDowell, W.H., W.B. Bowden, and C.E. Asbury (1992) Riparian nitrogen dynamics in two geomorphologically distinct tropical rain forest watersheds:subsurface solute patterns. Biogeochemistry 18(2); 53-75. ↵
Meals, D.W. 1993. Assessing nonpoint phosphorus control in the LaPlatte River watershed. Lake Reservoir Manage. 7(2):197-207. ↵
Miner, D., G. Jennings, and M.C. Wiggins. 1996. North Carolina Cooperative Extension Service 1995 drinking water nitrate screening. In: Solutions: A Technical Conference on Water Quality. Proceedings, March 19-21, 1996. North Carolina State University, Raleigh, NC. ↵
Mitsch, W.J. 1993. Landscape design and the role of created, restored, and natural riparian wetlands in controlling nonpoint source pollution. Pages 43-70. In: Created and Natural Wetlands for Controlling Nonpoint Source Pollution, R.K. Olson (ed.), CRC Press, Boca Raton, FL. ↵
Mitsch, W.J. 1992. Landscape design and the role of created, restored, and natural riparian wetlands in controlling nonpoint source pollution. Ecological Eng. 1:27- 47. ↵
Mitsch, W.J. and J.G. Gosselink. 1993. Wetlands. 2nd Edition. Van Nostrand Reinhold, New York, NY. ↵
NCDEHNR. 1997. Report of Proceedings on the Proposed Neuse River Basin Nutrient Sensitive Waters (NSW) Management Strategy. Environmental Management Commission Meeting, June 12, 1997, State of North Carolina, Department of Environment, Health and Natural Resources, Raleigh, NC. ↵
Osmond, D.L., L. Xu, N.N. Ranells, S.C. Hodges, R.Hansard, and S.H. Pratt. 2001. Nitrogen loss estimation worksheet (NLEW): An agricultural nitrogen loading reduction tracking tool. Scientific World:1. ↵
Osmond, D.L., D.E. Line, J.A. Gale, R.W. Gannon, C.B. Knott, K.A. Bartenhagen, M.H. Turner, S.W. Coffey, J. Spooner, J. Wells, J.C. Walker, L.L. Hargrove, M.A. Foster, P.D. Robillard, and D.W. Lehning. 1995a. WATERSHEDSS: Water, Soil and Hydro-Environmental Decision Support System. ↵
Osmond, D.L., J. Spooner, and D.E. Line. 1995b. Systems of Best Management Practices for Controlling Agricultural Nonpoint Source Pollution: The Rural Clean Water Program Experience. Fact Sheet no. 6. NCSU Water Quality Group, North Carolina State University, Raleigh, NC. ↵
Peterjohn, W.T., and D.L. Correll. 1984. Nutrient dynamics in an agricultural watershed: Observations on the role of a riparian forest. Ecology 65:1466-1475. ↵
Rosgen, D. 1996. Applied River Morphology. Wildlife Hydrology, Pagosa Springs, CO. ↵
Skaggs, R.W. and J.W. Gilliam. 1981. Effect of drainage system design on nitrate transport. Trans. Am. Soc. Ag. Eng. 24:929-934, 940. ↵
Skaggs, R.W., J.W. Gilliam, T.J. Sheets, and J.S. Barnes. 1980. Effect of agricultural land development on drainage waters in the North Carolina Tidewater Region. Water Resources Research Institute of The University of North Carolina. Rep. No. 159. ↵
Skaggs, R.W., A. Tabrizi, and G.R. Foster. 1982. Subsurface drainage effects on erosion. J. Soil and Water Conser v. 37:167-172. ↵
Sweeney, B.W. 1992. Streamside forests and the physical, chemical, and tropic characteristics of Piedmont streams in Eastern North America. Water Sci. Tech. 26:2653-2673. ↵
Sweeney, B.W. 1993. Effects of streamside vegetation on macroinvertebrate communities of White Clay Creek in Eastern North America. Proceedings of the Academy of Natural Sciences of Philadelphia 144:291-340. ↵
Thompson, J.N. and D.L. Green. 1994. Riparian Restoration and Streamside Erosion Control Handbook. Nonpoint Source Program, Division of Water Pollution Control, Tennessee Department of Environment and Conservation, Nashville, TN. ↵
USDA. 1997. Riparian Forest Buffer Handbook for the Chesapeake Bay Watershed. United States Department of Agriculture, Environmental Protection Agency, Forest Service and Northeastern Area State & Private Forestry, NA-TT-02-97. Washington, DC. ↵
USDA-NRCS. 2000. Conservation Buffers to Reduce Pesticide Losses. Natural Resources Conservation Service. Fort Worth, Tx. ↵
USEPA. 1995a. National Water Quality Inventory: 1994 Report to Congress (Appendixes). United States Environmental Protection Agency, Office of Water, Washington, DC. EPA841-R-95-006. ↵
USEPA. 1995b. Water Quality Functions of Riparian Forest Buffer Systems in the Chesapeake Bay Watershed. Chesapeake Bay Program, United States Environment Protection Agency, Washington, DC. EPA 903-R-95-004. ↵
USEPA. 1990. National Pesticide Phase I Report. Executive Summary. United States Environmental Protection Agency, Washington, DC. ↵
USEPA. 1989. A Report to Congress: Activities and Program Implemented Under Section 319 of the Clean Water Act - Fiscal year 1988. United States Environmental Protection Agency, Office of Water, Washington, DC. EPA Rep. 506/9-89/003. ↵
van der Valk, A. and R. Jolly. 1993. Recommendations for research to develop guidelines for the use of wetlands to control rural nonpoint source pollution. Pages 167- 190. In: Created and Natural Wetlands for Controlling Nonpoint Source Pollution, R.K. Olson (ed.), CRC Press, Boca Raton, FL. ↵
Verchot, L.V., E.C. Franklin, and J.W. Gilliam. 1995. Nitrogen Biogeochemical Cycling in Piedmont Vegetated Filter Zones. Ph.D. Dissertation, College of Forest Resources, North Carolina State University, Raleigh, NC. ↵
Wade, H., C. Bailey, J. Packmore, B. Williams, and A. York. 1997. Interagency Study of the Impact of Pesticide Use on Ground Water in North Carolina (Draft). The North Carolina Pesticide Board, Raleigh, NC. ↵
Welsch, D.J. 1991. Riparian Forest Buffers: Function And Design For Protection And Enhancement Of Water Resources. USDA Forest Service, Northeastern Area, Radnor, PA. NA-PR-07-91. ↵
Wenger, S. 1998. Review of Scientific Literature on Riparian Buffer Width, Extent and Vegetation. Institute of Ecology, Univ. GA, 62 pp. ↵
Whigham, D.F., C. Chitterling, and B. Palmer. 1988. Impacts of freshwater wetlands on water quality. Environ Manag. 12(5):663-671. ↵
Publication date: Jan. 1, 2002
Revised: July 27, 2023
TB-318
N.C. Cooperative Extension prohibits discrimination and harassment regardless of age, color, disability, family and marital status, gender identity, national origin, political beliefs, race, religion, sex (including pregnancy), sexual orientation and veteran status.