
Background
Every animal operation in North Carolina of a certain size now must have a certified animal waste management plan, as mandated by state environmental regulations. Affected are all farms with 250 or more swine, 100 or more confined cattle, 75 or more horses, and/or 1,000 or more sheep, but only poultry enterprises of 30,000 or more birds that use a liquid waste system.
A key component of this overall certified animal waste management plan is a waste utilization program. Based on the volume of waste produced, on the nutrient concentration in the waste, and on the nutrient requirements of the receiving crop, the certified management plan will define the number of acres and types of crops to be grown on the farm and will help determine the environmentally sound cropping systems that are ultimately used for land application of the manure nutrients.
Currently, the certified waste management plan must meet the technical standards of the Natural Resources Conservation Service (NRCS), some of which are shown in Tables 1 and 2. Using those standards as guidance, the animal waste management plan estimates the amount of waste generated and, subsequently, the total amount of plant-available nutrients. For illustration purposes, this publication will use swine farm examples, although the process is valid on any farm with a liquid waste management system.
Total PAN Estimates From State Averages
NRCS standards provide waste generation rates for various production units based on statewide averages (Table 1). Using average production unit values and the average nutrient concentration (Table 2), total plant-available nitrogen (PAN) can be estimated, provided the number of animals to be raised is known.
| Production unit | Animal unit | Anaerobic Lagoon Liquid1 | Anaerobic Lagoon Sludge |
| Gallons per animal unit per year | |||
| Weanling-to-feeder | per head | 191 | 6.7 |
| Feeder-to-finish | per head | 927 | 33 |
| Farrow-to-weanling | per active sow | 3,203 | 78 |
| Farrow-to-feeder | per active sow | 3,861 | 94 |
| Farrow-to-finish | per active sow | 10,478 | 382 |
| 1 Estimated total lagoon liquid includes total liquid waste plus average annual rainfall surplus falling on lagoon. | |||
Example A
A new farrow-to-finish operation for 5,000 sows is planned. Because it is a new farm with no on-farm waste management records, state averages found in NRCS technical standards must be used in preparing the certified animal waste management plan. A key question is: How much lagoon liquid will be generated and land-applied each year? To answer this question, use the this formula and Table 1.
| Production System | NCDA&CS Waste Code | Total N | PAN Irrigated | PAN Injected |
| pounds of total nutrient per 1,000 gallons* | ||||
| Anaerobic Lagoon Liquid – Swine | ALS | |||
| Boar | 3.6 | 1.8 | 2.2 | |
| Farrow-to-Wean | 2.4 | 1.2 | 1.4 | |
| Farrow-to-Feeder | 3.6 | 1.8 | 2.2 | |
| Farrow-to-Finish | 3.6 | 1.8 | 2.2 | |
| Wean-to-Feeder | 3.6 | 1.8 | 2.2 | |
| Wean-to-Finish | 3.6 | 1.8 | 2.2 | |
| Feeder-to-Finish | 3.6 | 1.8 | 2.2 | |
| Anaerobic Lagoon Sludge – Swine | ASS | 20.4 | 10.2 | 12.2 |
Factors such as age and class of animal, genetics and diet, lagoon size, and solids removal may cause each facility to deviate from the NRCS averages shown in Tables 1 and 2. Management of individual farms may be improved by using site-specific data, as will be shown in the following section. For additional examples and a more detailed discussion of factors affecting plant-available nitrogen, refer to Chapter 3 of the manual on Certification Training for Operators of Animal Waste Management Systems (Type A and Type B).The farmer relies on an anaerobic lagoon and expects to use an irrigation system to land-apply the lagoon liquid. Now the question is: How many pounds of total PAN will be generated and land-applied each year? To answer this question, use this formula, plus Table 2 and the result from the previous calculation.
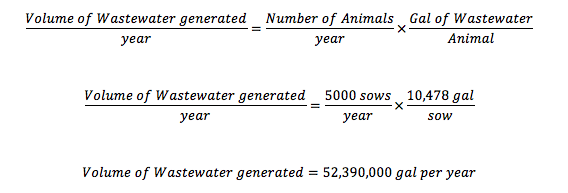
Figure 1. Example A volume formula.
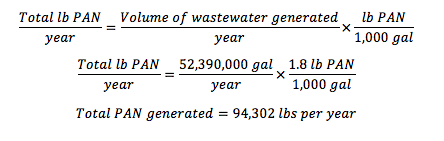
Figure 2. Example A PAN formula.
Total PAN Estimates From On-Farm Data
Under specific conditions, estimates of the total pounds of PAN generated may be more accurate if farm records can be used in lieu of NRCS standards. However, to accurately calculate a facility’s PAN production, waste analysis data and actual volumes applied over an extended period (i.e., at least three years) must be collected.
To insure reliable data, use the following guidelines to calculate total pounds of PAN:
- Use three years of records for both nutrient concentrations and annual liquid volumes to determine farm averages. For lagoon-based waste management systems, collect at least three samples annually with seasonal variation for nutrient analysis. For systems using waste storage ponds, collect at least two samples annually with seasonal variation for nutrient analysis. Follow recommended sampling procedures. A description of these sampling procedures may be found in SoilFacts: Waste Analysis.
- The samples should be analyzed by either the North Carolina Department of Agriculture & Consumer Services Agronomic Division or a reputable private laboratory. All the analyses must be used to compute the average N (nitrogen) concentration. The analyses also should be included as an appendix in the revised certified animal waste management plan.
- Records of annual lagoon liquid volumes applied may be obtained from standard land application records (e.g., NRCS Form IRR-2). Volume data must be used from the years corresponding to the waste analysis records. The volume data should be included as an appendix to the revised certified animal waste management plan.
- Do not use extreme sample analysis values to determine the averages. The NRCS standards database, based on 1,403 data points, shows that one statistical standard deviation represents a 48% deviation from the mean for swine lagoon liquid N. Therefore, any value used to calculate the three-year average N concentration that lies outside the mean plus or minus 48% should not be used to calculate the farm average. For calculating the average, at least two-thirds of the samples must be within 48% of the average, including at least one sample per 12-month period.
To calculate the average N concentration, all sample values must be considered. First, average all values. Next, exclude any values that are more or less than 48% of the average. Then calculate the average using the remaining values. Multiply this second average by the average annual volume to determine the facilities’ PAN production, based on actual site-specific data.
Example B
Consider the same farm described above, a farrow-to-finish operation with 5,000 sows, only this time the farm has sufficient on-farm records. A quick review of the farm records indicates there are 19 fields in the land-application program and complete irrigation records for 1998, 1997, and 1996.
Using actual data from the farm, on average, how much lagoon liquid will be generated and land-applied each year?
To answer this question, first determine the volume of lagoon liquid applied each year (Table 3). Add the values for each year to calculate the total volume of wastewater irrigated annually:
63,570,940 gallons in 1998.
56,675,620 gallons in 1997.
66,423,560 gallons in 1996.
The three-year average is 62,223,373 gallons. In this case, the farmer’s records indicate he is land-applying more wastewater than would have been estimated using NRCS technical standards. However, whether the farmer is applying more nitrogen depends on the nitrogen concentration of the wastewater. To determine the total pounds of PAN being applied, we need to consider the PAN concentration in the lagoons on the farm.
| Yearly gallons applied | |||
|---|---|---|---|
| Field | 1998 | 1997 | 1996 |
| 1 | 8,095,000 | 5,106,000 | 8,661,000 |
| 2 | 3,885,000 | 3,234,000 | 7,266,000 |
| 3 | 3,495,000 | 3,920,470 | 2,160,000 |
| 4 | 6,204,000 | 4,005,000 | 1,686,000 |
| 5 | 300,000 | 273,600 | 386,400 |
| 6 | 101,280 | 381,960 | 164,160 |
| 7 | 1,287,000 | 1,009,500 | 1,815,000 |
| 8 | 1,179,000 | 963,000 | 1,788,000 |
| 9 | 310,080 | 297,600 | 458,400 |
| 10 | 805,920 | 645,120 | 994,560 |
| 11 | 851,040 | 742,080 | 1,189,800 |
| 12 | 223,680 | 568,470 | 831,720 |
| 13 | 3,505,500 | 3,606,000 | 4,221,000 |
| 14 | 12,421,500 | 10,175,100 | 13,655,000 |
| 15 | 12,729,000 | 10,969,200 | 13,068,000 |
| 16 | 582,000 | 614,400 | 591,840 |
| 17 | 1,178,640 | 927,120 | 919,680 |
| 18 | 2,169,300 | 4,896,000 | 3,030,000 |
| 19 | 4,248,000 | 4,341,000 | 3,537,000 |
| Total | 63,570,940 | 56,675,620 | 66,423,560 |
| Average annual volume applied - 62,223,373 | |||
A further review of farm records indicates that five lagoons are actively used in the waste management system. For each lagoon, there are three years of waste analysis records, which have been summarized in Table 4.
| Lagoon 1 | Lagoon 2 | Lagoon 3 | Lagoon 4 | Lagoon 5 | ||||||
|---|---|---|---|---|---|---|---|---|---|---|
| Month | Year | PAN1 | Year | PAN1 | Year | PAN1 | Year | PAN1 | Year | PAN1 |
| March | 1998 | 3.80 | 1998 | 2.42 | 1998 | 2.07 | 1998 | 2.57 | 1998 | 2.21 |
| June | 1998 | 2.37 | 1998 | 2.03 | 1998 | 5.68 | 1998 | 2.23 | 1998 | 1.24 |
| September | 1998 | 2.55 | 1998 | 3.23 | 1998 | 2.47 | 1998 | 3.98 | 1998 | 2.55 |
| April | 1997 | 2.64 | 1997 | 2.69 | 1997 | 2.66 | 1997 | 2.41 | 1997 | 2.16 |
| June | 1997 | 2.67 | 1997 | 0.24 | 1997 | 2.60 | 1997 | 2.62 | 1997 | 2.16 |
| September | 1997 | 2.47 | 1997 | 2.34 | 1997 | 2.34 | 1997 | 2.68 | 1997 | 2.64 |
| April | 1996 | 3.61 | 1996 | 3.25 | 1996 | 3.15 | 1996 | 2.91 | 1996 | 1.09 |
| September | 1996 | 2.05 | 1996 | 2.12 | 1996 | 1.94 | 1996 | 2.15 | 1996 | 1.89 |
| Average by lagoon | 2.77 | 2.29 | 2.86 | 2.69 | 1.99 | |||||
| Farm Average | 2.52 pounds per 1,000 gallons | |||||||||
| 1 Plant-available N from waste analysis report, in pounds per 1,000 gallons | ||||||||||
| Lagoon 1 | Lagoon 2 | Lagoon 3 | Lagoon 4 | Lagoon 5 | ||||||
|---|---|---|---|---|---|---|---|---|---|---|
| Month | Year | PAN1 | Year | PAN1 | Year | PAN1 | Year | PAN1 | Year | PAN1 |
| March | 1998 | 1998 | 2.42 | 1998 | 2.07 | 1998 | 2.57 | 1998 | 2.21 | |
| June | 1998 | 2.37 | 1998 | 2.03 | 1998 | 1998 | 2.23 | 1998 | ||
| September | 1998 | 2.55 | 1998 | 3.23 | 1998 | 2.47 | 1998 | 1998 | 2.55 | |
| April | 1997 | 2.64 | 1997 | 2.69 | 1997 | 2.66 | 1997 | 2.41 | 1997 | 2.16 |
| June | 1997 | 2.67 | 1997 | 1997 | 2.60 | 1997 | 2.62 | 1997 | 2.16 | |
| September | 1997 | 2.47 | 1997 | 2.34 | 1997 | 2.34 | 1997 | 2.68 | 1997 | 2.64 |
| April | 1996 | 3.61 | 1996 | 3.25 | 1996 | 3.15 | 1996 | 2.91 | 1996 | |
| September | 1996 | 2.05 | 1996 | 2.12 | 1996 | 1.94 | 1996 | 2.15 | 1996 | 1.89 |
| Average by lagoon | 2.62 | 2.58 | 2.46 | 2.51 | 2.27 | |||||
| Farm Average | 2.49 pounds per 1,000 gallons | |||||||||
| 1 Plant-available N from waste analysis report, in pounds per 1,000 gallons | ||||||||||
As indicated in guideline 4 above, do not use extreme sample analysis values to determine the averages. To determine which values ultimately to use, estimate one standard average. Based on the thousands of samples compiled in developing the NRCS database, one standard deviation would be approximately 48% of the average PAN. This can be calculated using the following equation:
Standard deviation for waste analyses = 0.48 x average PAN
Standard deviation for waste analyses = 0.48 x 2.52 lb/1,000 gal
Standard deviation for waste analyses = 1.21 lb/1,000 gal
Using the newly figured standard deviation of 1.21 pounds per 1,000 gallons, calculate the range of waste values to include in the final average:
Range of values to include in average = Average of waste analyses ± Standard deviation
Range of values to include in average = 2.52 ± 1.21
Range of values to include in average = 1.31 to 3.73 lb/1,000 gal
Using the data from Table 4, calculate the second on-farm average by omitting the values that fall outside the range of 1.31 to 3.73 pounds per 1,000 gallons:
Use this formula to multiply the second average by the average annual volume of wastewater applied (Table 3) to determine the facilities’ PAN production.
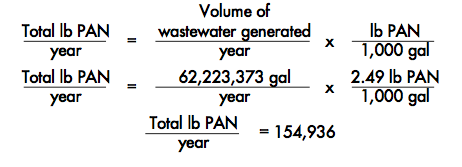
Figure 3. Example B Formula.
Summary
The use of on-farm records can work to an animal producer’s benefit by providing more site-specific information about how an animal waste management system should be operated, particularly with respect to the number of acres of crops necessary to properly utilize the nutrients (mainly nitrogen) in the wastewater. Historically, waste management plans have been developed based on the state averages used in the NRCS technical standards. Although the standards are an excellent beginning for farms without waste management records, existing farms with records should incorporate their site-specific data into further refined waste management plans.
However, on-farm records should be used only if complete. For example, PAN concentrations in wastewater provide little insight into the total pounds of PAN to be applied without knowledge of how many gallons of wastewater are to be applied. Likewise, situations may exist in which a farmer applies more wastewater than expected, yet that wastewater has a lower PAN concentration than expected so overall the farmer applies fewer total pounds of PAN.
Ultimately, using comprehensive on-farm wastewater records can improve the management of the land-application program, as long as the records are used appropriately.
Acknowledgements
This publication is a revision of an earlier version. The authors would like to thank J. Barker and David Crouse for their earlier contributions.
References
Crouse, D.A., and K.A. Shaffer, eds. 2006. Certification Training for Operators of Animal Waste Management Systems - Type A. AG-538A. Raleigh, NC: North Carolina Cooperative Extension.
Crouse, D.A., and K.A. Shaffer, eds. 2006. Certification Training for Operators of Animal Waste Management Systems - Type B. AG-538A. Raleigh, NC: North Carolina Cooperative Extension.
Crouse, D. and B. Cleveland. 2015. SoilFacts: Waste Analysis. AG-439-33. Raleigh, NC: North Carolina Cooperative Extension.
Publication date: June 4, 2015
AG-439-42
N.C. Cooperative Extension prohibits discrimination and harassment regardless of age, color, disability, family and marital status, gender identity, national origin, political beliefs, race, religion, sex (including pregnancy), sexual orientation and veteran status.