
Timber Income Data, North Carolina, 2022
| County | Acres of timberland1 | Percent Timberland | Stumpage Value2 | Delivered Value3 | Rank4 |
|---|---|---|---|---|---|
| Alamance | 138,741 | 51% | 4,741,139 | 8,272,314 | 53 |
| Alexander | 103,335 | 62% | 2,445,618 | 4,344,719 | 77 |
| Alleghany | 69,667 | 46% | 2,088,799 | 4,218,852 | 80 |
| Anson | 208,585 | 61% | 22,943,037 | 42,358,600 | 1 |
| Ashe | 174,382 | 64% | 2,339,264 | 4,452,246 | 75 |
| Avery | 124,062 | 78% | 1,736,015 | 2,894,660 | 89 |
| Beaufort | 347,930 | 65% | 18,452,350 | 37,690,864 | 4 |
| Bertie | 321,437 | 72% | 18,216,801 | 40,362,832 | 2 |
| Bladen | 406,974 | 73% | 14,182,461 | 28,554,621 | 11 |
| Brunswick | 415,191 | 76% | 16,498,644 | 31,290,036 | 7 |
| Buncombe | 223,600 | 53% | 2,520,955 | 4,594,464 | 73 |
| Burke | 234,884 | 72% | 2,972,551 | 6,264,984 | 63 |
| Cabarrus | 93,560 | 40% | 4,433,888 | 7,797,544 | 55 |
| Caldwell | 239,692 | 79% | 5,141,053 | 8,672,538 | 51 |
| Camden | 72,286 | 47% | 339,849 | 630,301 | 98 |
| Carteret | 163,931 | 50% | 5,987,045 | 10,826,139 | 45 |
| Caswell | 192,594 | 71% | 3,321,905 | 8,414,926 | 52 |
| Catawba | 81,319 | 32% | 2,116,867 | 4,864,678 | 69 |
| Chatham | 252,733 | 58% | 9,709,427 | 21,047,702 | 19 |
| Cherokee | 255,671 | 88% | 2,124,874 | 4,461,394 | 74 |
| Chowan | 51,570 | 47% | 1,475,337 | 3,948,903 | 82 |
| Clay | 87,369 | 63% | 686,237 | 1,915,992 | 92 |
| Cleveland | 140,512 | 47% | 1,737,786 | 4,762,713 | 71 |
| Columbus | 369,647 | 62% | 17,411,354 | 38,153,055 | 3 |
| Craven | 272,567 | 60% | 13,815,986 | 26,443,863 | 12 |
| Cumberland | 228,621 | 55% | 5,406,003 | 11,647,728 | 42 |
| Currituck | 39,772 | 24% | 160,964 | 335,549 | 99 |
| Dare | 53,036 | 22% | 59,373 | 157,685 | 100 |
| Davidson | 183,235 | 52% | 11,332,152 | 20,812,464 | 20 |
| Davie | 72,865 | 43% | 4,493,002 | 8,031,905 | 54 |
| Duplin | 263,274 | 50% | 7,357,111 | 15,390,371 | 30 |
| Durham | 87,707 | 48% | 242,712 | 903,949 | 95 |
| Edgecombe | 169,916 | 53% | 5,723,337 | 13,631,318 | 35 |
| Forsyth | 105,411 | 40% | 1,896,607 | 3,481,585 | 86 |
| Franklin | 184,673 | 59% | 12,009,572 | 23,535,957 | 17 |
| Gaston | 96,857 | 43% | 861,110 | 1,886,847 | 93 |
| Gates | 120,154 | 55% | 6,184,232 | 15,027,872 | 32 |
| Graham | 147,395 | 79% | 836,050 | 1,756,322 | 94 |
| Granville | 230,262 | 68% | 6,196,214 | 12,925,989 | 39 |
| Greene | 57,052 | 33% | 2,037,326 | 4,724,011 | 72 |
| Guilford | 172,449 | 42% | 2,741,896 | 5,129,994 | 66 |
| Halifax | 291,503 | 63% | 12,571,736 | 29,693,287 | 8 |
| Harnett | 208,671 | 55% | 14,191,050 | 24,934,827 | 15 |
| Haywood | 204,837 | 58% | 1,804,105 | 4,026,493 | 81 |
| Henderson | 146,263 | 61% | 4,100,983 | 7,112,907 | 59 |
| Hertford | 160,912 | 71% | 5,595,408 | 13,020,223 | 38 |
| Hoke | 173,670 | 70% | 5,956,859 | 11,896,953 | 41 |
| Hyde | 179,173 | 46% | 4,551,910 | 9,829,447 | 48 |
| Iredell | 118,644 | 32% | 6,181,233 | 12,527,601 | 40 |
| Jackson | 266,007 | 85% | 1,298,688 | 2,119,788 | 91 |
| Johnston | 228,991 | 45% | 6,751,705 | 13,708,400 | 34 |
| Jones | 222,170 | 74% | 10,719,303 | 21,437,439 | 18 |
| Lee | 97,353 | 60% | 10,072,733 | 17,398,204 | 26 |
| Lenoir | 131,377 | 51% | 4,467,795 | 8,699,908 | 50 |
| Lincoln | 87,650 | 46% | 1,393,473 | 2,590,180 | 90 |
| Macon | 240,699 | 73% | 1,720,338 | 3,574,912 | 84 |
| Madison | 272,915 | 95% | 2,508,602 | 4,243,135 | 79 |
| Martin | 211,478 | 72% | 10,956,842 | 23,555,073 | 16 |
| McDowell | 221,704 | 79% | 3,411,518 | 6,601,044 | 62 |
| Mecklenburg | 95,480 | 28% | 2,887,071 | 5,398,150 | 64 |
| Mitchell | 103,937 | 73% | 3,417,647 | 6,620,565 | 61 |
| Montgomery | 244,349 | 78% | 19,834,539 | 35,187,263 | 5 |
| Moore | 306,305 | 69% | 17,448,294 | 32,543,135 | 6 |
| Nash | 183,045 | 53% | 8,283,487 | 17,885,609 | 25 |
| New Hanover | 36,218 | 29% | 2,011,605 | 3,616,931 | 83 |
| Northampton | 242,906 | 71% | 8,317,409 | 18,471,230 | 24 |
| Onslow | 348,930 | 72% | 7,503,383 | 15,921,535 | 28 |
| Orange | 128,526 | 51% | 1,739,486 | 3,379,857 | 87 |
| Pamlico | 153,115 | 71% | 9,986,091 | 18,484,271 | 23 |
| Pasquotank | 27,032 | 19% | 1,531,949 | 3,507,003 | 85 |
| Pender | 426,479 | 76% | 11,472,385 | 25,653,534 | 13 |
| Perquiman | 72,644 | 46% | 2,309,733 | 4,934,436 | 68 |
| Person | 140,490 | 56% | 3,577,700 | 9,020,032 | 49 |
| Pitt | 162,021 | 39% | 8,956,356 | 18,738,213 | 22 |
| Polk | 84,455 | 56% | 2,053,066 | 4,387,811 | 76 |
| Randolph | 279,161 | 56% | 15,771,494 | 28,881,148 | 9 |
| Richmond | 240,687 | 79% | 15,184,583 | 28,634,301 | 10 |
| Robeson | 344,924 | 57% | 5,305,828 | 13,314,578 | 37 |
| Rockingham | 246,196 | 68% | 3,410,729 | 7,260,097 | 57 |
| Rowan | 135,492 | 41% | 8,207,765 | 15,096,743 | 31 |
| Rutherford | 224,143 | 62% | 3,569,431 | 7,412,838 | 56 |
| Sampson | 253,326 | 42% | 9,092,621 | 18,819,507 | 21 |
| Scotland | 135,500 | 66% | 5,646,440 | 11,421,097 | 43 |
| Stanly | 112,798 | 45% | 5,274,679 | 10,416,530 | 47 |
| Stokes | 191,043 | 66% | 2,214,779 | 4,261,658 | 78 |
| Surry | 209,534 | 61% | 3,630,226 | 7,136,679 | 58 |
| Swain | 92,159 | 27% | 380,890 | 650,041 | 97 |
| Transylvania | 213,755 | 88% | 461,716 | 791,899 | 96 |
| Tyrrell | 108,758 | 43% | 2,295,028 | 5,265,387 | 65 |
| Union | 154,888 | 38% | 2,461,668 | 4,793,454 | 70 |
| Vance | 112,747 | 70% | 1,887,029 | 5,012,457 | 67 |
| Wake | 165,143 | 31% | 8,219,407 | 15,483,010 | 29 |
| Warren | 227,436 | 83% | 12,348,575 | 25,296,030 | 14 |
| Washington | 98,925 | 45% | 5,306,606 | 10,871,880 | 44 |
| Watauga | 118,538 | 59% | 1,820,911 | 3,023,496 | 88 |
| Wayne | 168,880 | 48% | 6,969,608 | 13,453,511 | 36 |
| Wilkes | 342,277 | 71% | 8,295,409 | 14,796,699 | 33 |
| Wilson | 82,906 | 35% | 5,593,016 | 10,721,555 | 46 |
| Yadkin | 83,954 | 39% | 3,520,857 | 6,646,582 | 60 |
| Yancey | 151,123 | 76% | 9,769,675 | 15,940,393 | 27 |
| State Total | 17,969,160 | 58% | 611,200,356 | 1,222,739,454 |
1Timberland = forest land capable of producing in excess of 20 cubic feet per acre per year of industrial wood in natural stands.↵
2Stumpage = price paid to landowners for standing timber.↵
3Delivered = price paid to timber buyers upon delivery of timber to the mill.↵
4Ranking is highest (1) to lowest (100) based on counties’ delivered income values.↵
Data sources: US Forest Service, Evalidator Version 2.1.0, Forest Inventory and Analysis Data (Retrieved 01/12/2024), 2022 Timber Products Output Survey, and 2022 Timber Mart South, Vol. 47.
North Carolina Facts
- In 2022, the value of timber harvests (stumpage value) in NC was $611 million, up 5.7 ($33.2 million) from 2021.
- Wood delivered to mills represents about $1,223 million in 2022, up $65,405 million (5.7%) from 2021.
2022 Harvest Utilizationa
(million cubic feet)
| Sawlogs | 338 |
|---|---|
| Pulpwood | 249 |
| Veneer logs | 55 |
| Composites (other industrial, bioenergy) | 146 |
Sources: a 2021 USFS Timber Products Output Survey ↵
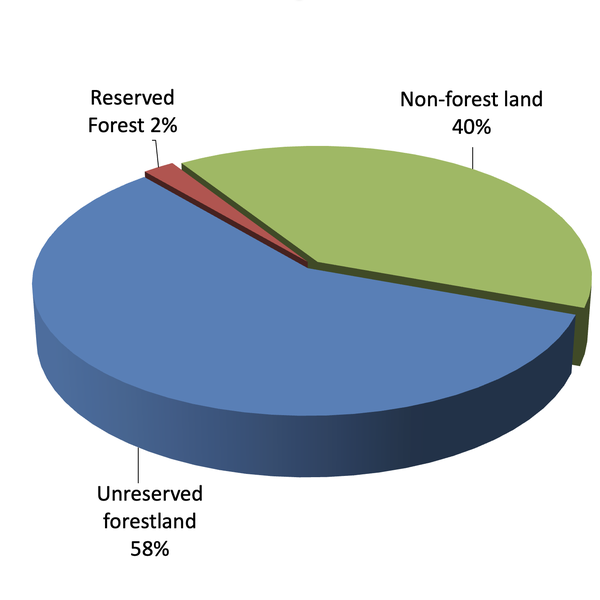
Distribution of unreserved forest, reserved forest and non-forest land in North Carolina, 2022
North Carolina is over 30.9 million acres of land that is distributed between reserved forest land (2%) unreserved forest land (58%) and non-forest land (40%). Reserved forestland is withdrawn from the potential to be managed for wood products through statute or administrative designation. Examples include designated Federal wilderness areas, national parks and monuments, and most State parks. Unreserved forest land is available to be managed for production of wood products.
Area of Timberland by Ownership
North Carolina has approximately 18 million acres of unreserved forestland that is classifed as timberland; which is unreserved forestland capable of producing 20 cubic feet or more of commercial timber. Of the 18 million acres 85 percent is privately owned, 8 percent is owned by the federal government and 7 percent is owned by state and local governments.
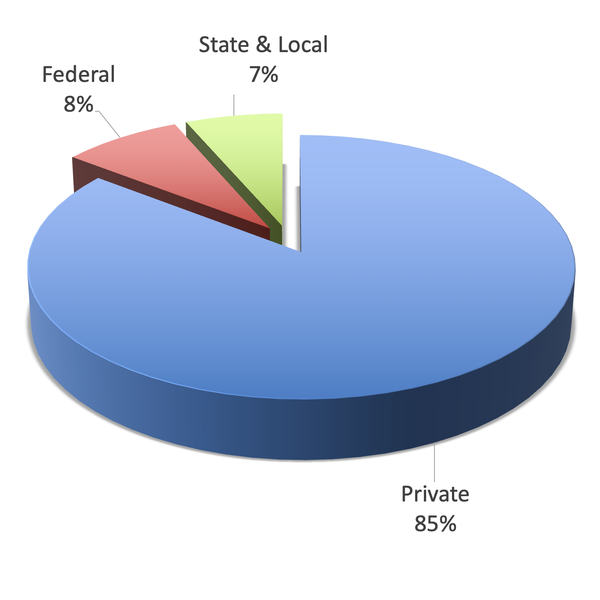
Area of timberland by ownership in North Carolina, 2022
Distribution of unreserved forest, reserved forest and non-forest land in North Carolina, 2022
Publication date: Jan. 17, 2024
N.C. Cooperative Extension prohibits discrimination and harassment regardless of age, color, disability, family and marital status, gender identity, national origin, political beliefs, race, religion, sex (including pregnancy), sexual orientation and veteran status.