A Brief Historical Perspective
North Carolina soils are naturally acidic and deficient in phosphorus (P). Liming and P fertilization historically led to very positive impacts in crop yields, and these practices were considered critical for soil fertility improvement in North Carolina. Applied research from the early 1940s defined the economic optimum rates of fertilizers to maximize yields for a variety of crops on predominant soils, using soil analysis as the tool to guide fertility recommendations. With collaboration between the North Carolina Department of Agriculture and Consumer Services (NCDA&CS) Agronomic Division and North Carolina State University’s Department of Soil Science, soil test calibration studies were frequently conducted from 1950 to 1980. These studies focused on defining the economic optimum P rate for each soil test P level and crop species.
In the mid-1970s, concerns over differences in fertilizer recommendations between public land-grant university labs in neighboring states fostered the establishment of the Mid-Atlantic Soil Test Work Group, which has met annually for more than 35 years. Knowledge gained in these discussions and North Carolina soil test calibration studies established the soil test P critical level, a value above which the probability of a yield response to P fertilizer was low and therefore not economically viable.
In 1972, soil test calibration research was translated into practical recommendations for growers and the agricultural industry in the Crop Fertilization Based on North Carolina Soil Tests guide, commonly referred to as the “Orange Book” (Hardy et al. 2014). Since the early 1950s, P recommendations had been based on the Mehlich 1 soil test extractant, but the Mehlich 3 soil test extractant was adopted in the mid-1980s. The latter was considered an improvement from Mehlich 1 because it was developed as a multinutrient extractant (P, K, S, and micronutrients). After the 1990s, soil P test calibration studies as referenced herein were rarely conducted because critical levels were already established, and few resources existed to calibrate Mehlich 3 soil test with crop response to P fertilization.
Critical Levels and Fertilizer Recommendations
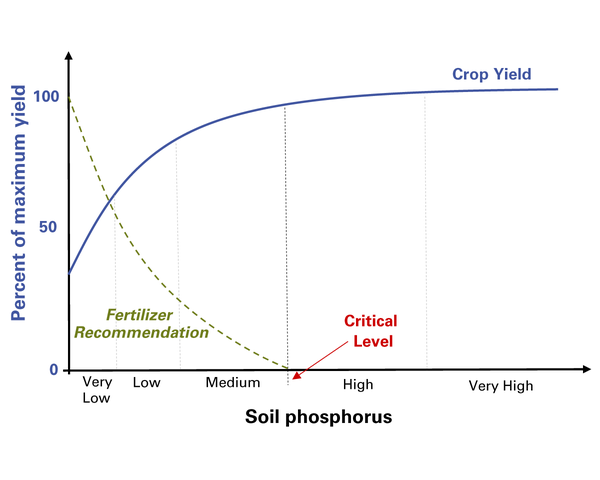
In general, plants respond to P fertilization when soils are P-limiting, but as the soil test level increases to the critical level, crop response to added P decreases (Figure 1). Commonly, fertilization is not profitable after the crop yield reaches 90% to 95% of the maximum yield because the cost of P fertilization is greater than the economic return. Soils with P levels below the critical level are classified as “Very Low,” “Low,” and “Medium” and represent, respectively, high, medium, and low response to P fertilization. Soil P levels above the critical level are classified as “High” and “Very High” and represent very low or no probability of a response to P fertilization (Figure 1). No fertilizer P should be recommended for the current crop when soil test P is greater than the critical level.
Phosphorus Critical Levels in North Carolina
Several factors influence the critical soil test P level in North Carolina soils; therefore, designating a critical soil test range may better represent the variability in critical levels found in field studies (Tables 1 and 2). These factors include:
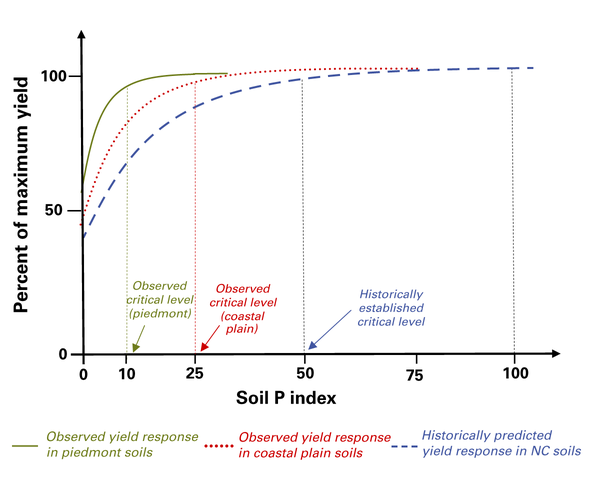
- Clay content: At the same soil test level, a clay soil has a greater capacity to supply P to roots, compared to a sandy soil. This capacity in clays is due to higher diffusion of P and greater buffering capacity, which represents replenishing plant-available P in soil with crop removal. For example, in coastal plain soils for wheat and corn, the critical P-I range is 14 to 33 with an average of 23 (Table 1), while in Piedmont soils, the critical P-I range is 7 to 13 with a mean of 9 (Table 2).
- Crop species: Response to P fertilization varies depending on crop species (Table 1). Based on these data, the mean P-I for corn, cotton, soybean, and wheat grown on a Portsmouth soil is 19, 34, 25, and 21, respectively. The size of a crop’s root system and crop growth rate are factors known to influence crop response to P.
- Growth environment: Critical levels are not static and fluctuate slightly between years, as the variation in climate (for example, temperature and moisture) affects nutrient uptake. For instance, years with below average rainfall require a greater P concentration in the soil because P uptake is driven by diffusion, which requires adequate soil moisture. Conversely, P uptake is enhanced in years with above average rainfall, resulting in slightly lower P critical levels.
Collectively, Tables 1 and 2 datasets demonstrate that the soil test P critical level is about 25 P-I for coastal plain soils and about 10 P-I for piedmont soils (Figure 2). Since the early 1990s, a single and conservative P critical level of 50 P-I has been used because (1) soil testing was recommended every two to four years, and (2) it was important to provide a two- to three-fold safety factor so that P was never limiting for the many diverse crops produced in North Carolina, including high-value rotational crops such as flue-cured tobacco. In addition, P fertilization recommendations were provided for crops grown on soils with 65 P-I.
| Crop | Soil series | Crop year | Critical level (P index)1 | Reference |
|---|---|---|---|---|
| Corn | Portsmouth | 1964 | 23 | Cox & Lins (1984) |
| Portsmouth | 1982 | 18 | Cox (1992) | |
| Portsmouth | 1984 | 28 | Cox (1992) | |
| Portsmouth | 1986 | 20 | Cox (1992) | |
| Portsmouth | 1988 | 28 | Cox (1992) | |
| Portsmouth | 1990 | 15 | Cox (1992) | |
| Portsmouth | 1992 | 19 | Cox (1996) | |
| Portsmouth | 1994 | 22 | Cox (1996) | |
| Goldsboro | 1984 | 23 | Cox & Barnes (2002) | |
| Goldsboro | 1988 | 17 | Cox & Barnes (2002) | |
| Goldsboro | 1991 | 22 | Cox & Barnes (2002) | |
| Goldsboro | 1994 | 15 | Cox & Barnes (2002) | |
| Goldsboro | 1997 | 14 | Cox & Barnes (2002) | |
| Average | 20 | |||
| Cotton | Goldsboro | 1990 | 11 | Cox & Barnes (2002) |
| Goldsboro | 1993 | 14 | Cox & Barnes (2002) | |
| Goldsboro | 1996 | 16 | Cox & Barnes (2002) | |
| Goldsboro | 1999 | 18 | Crozier et al. (2004) | |
| Goldsboro | 2002 | 18 | Crozier et al. (2004) | |
| Portsmouth | 1998 | 35 | Crozier et al. (2004) | |
| Portsmouth | 1999 | 32 | Crozier et al. (2004) | |
| Average | 21 | |||
| Peanut | Goldsboro | 1985 | 18 | Cox & Barnes (2002) |
| Goldsboro | 1987 | 17 | Cox & Barnes (2002) | |
| Goldsboro | 1989 | 20 | Cox & Barnes (2002) | |
| Goldsboro | 1992 | 14 | Cox & Barnes (2002) | |
| Goldsboro | 1995 | 17 | Cox & Barnes (2002) | |
| Goldsboro | 1998 | 18 | Cox & Barnes (2002) | |
| Average | 17 | |||
| Soybean | Portsmouth | 1983 | 34 | Cox (1992) |
| Portsmouth | 1985 | 19 | Cox (1992) | |
| Portsmouth | 1987 | 20 | Cox (1992) | |
| Portsmouth | 1989 | 26 | Cox (1992) | |
| Portsmouth | 1991 | 25 | Cox (1996) | |
| Portsmouth | 1993 | 23 | Cox (1996) | |
| Average | 25 | |||
| Wheat | Portsmouth | 1985 | 33 | Cox (1992) |
| Portsmouth | 1987 | 28 | Cox (1992) | |
| Portsmouth | 1989 | 28 | Cox (1992) | |
| Portsmouth | 1991 | 18 | Cox (1996) | |
| Portsmouth | 1993 | 17 | Cox (1996) | |
| Average | 25 | |||
| Average (all crops) | 21 | |||
| 1 Soil test P results in mg/dm3 were converted to P index (P-I = P mg/dm3/1.2). | ||||
| Crop | Soil series | Crop year | Critical level (P index)1 | Reference |
|---|---|---|---|---|
| Wheat | Georgeville | 1957 | 13 | Shelton et al. (1961)2 |
| Georgeville | 1958 | 13 | Shelton et al. (1961)2 | |
| Georgeville | 1959 | 5 | Shelton et al. (1961)2 | |
| Corn | Georgeville | 1964 | 7 | Cox & Lins (1984) |
| Davison | 1988 | 9 | Kamprath (1999) | |
| Davison | 1989 | 7 | Kamprath (1999) | |
| Average (all crops) | 9 | |||
| 1 Soil test P results in mg/dm3 were converted to P index (P-I = P mg/dm3/1.2). 2 Soil test P values were converted from Mehlich 1 to Mehlich 3 extractant (PM3 = PM1×1.50). |
||||
Phosphorus Rates Recommended for Row Crops in North Carolina
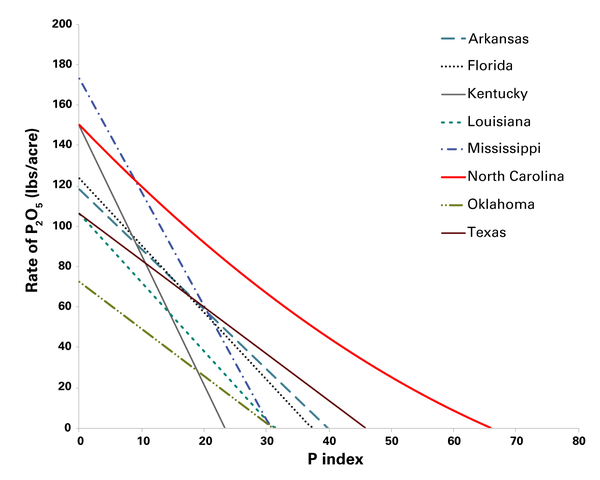
In the 1980s, as documented by NCDA&CS records, concern for P fertilization recommendations based on 50 P-I critical level was raised by NC State soil science faculty given that research data showed coastal plain and piedmont P-I critical levels to be about 25 and 10, respectively. However, no action was taken to update recommendations. Recently, Zhang et al. (2021) demonstrated that among all southern states, North Carolina has the highest P fertilizer rate recommendations in soils with P-I > 15 (Figure 3). Unlike most other southern states, in North Carolina, P fertilization is recommended between P-I 30 and 45, and P recommendations are provided up to P-I 65.
Phosphorus Accumulation in North Carolina Soils
The P management strategy adopted in North Carolina was designed to protect yield and avoid any possibility of P nutrient shortages. However, after decades of generous fertilization, most North Carolina soils routinely exhibit very high P sufficiency levels. From 2017 to 2019, the state’s average P-I was 137 for 712,000 agricultural soil samples analyzed by NCDA&CS, showing that in almost all North Carolina counties, average soil P was higher than the 50 P-I critical level (Kulesza 2020).
Soil test P buildup has led to long-term consequences as higher soil test P increases risk of P transport from fields to water resources, which increases eutrophication and leads to excess algae production and potential toxicity. There are numerous nutrient-impaired water resources (Neuse and Tar-Pamlico river basins and Jordan Lake, High Rock Lake, and Falls Lake watersheds) in North Carolina, which legally require P reductions from agriculture (North Carolina Department of Environmental Quality 2021). Data in some watersheds indicate that P fertilization represents 70% of the nonpoint source P runoff from agricultural fields.
Changes in the Phosphorus Recommendations
Data demonstrate that P recommendations for North Carolina crops are higher than those needed for adequate crop yields. The P critical levels used and rates of P fertilizers recommended are beyond those needed, and generally much greater than other southern states. To address this problem, the Interagency Soil Test Phosphorus Committee was created in 2021. This working group includes researchers from NC State (David Crouse, Luke Gatiboni, John Havlin, Stephanie Kulesza, Deanna Osmond, and Alex Woodley) and the NCDA&CS Agronomic Division (David Hardy and Colleen Hudak-Wise).
Using the research data available, the group concluded that the critical levels currently being used are higher than those observed and supported in North Carolina field studies. Consequently, the committee decided on three immediate actions: (1) recommend that no fertilizer P be used in soils with > 50 P-I; (2) initiate field and greenhouse studies to evaluate the soil test P critical levels in the coastal plain and piedmont soils, and decide if further modifications are needed; and (3) develop a mathematical model for the soil testing lab to identify soils from the piedmont region with high P buffer capacity that will allow a special P recommendation for those soils. All three actions were immediately initiated after the committee meeting.
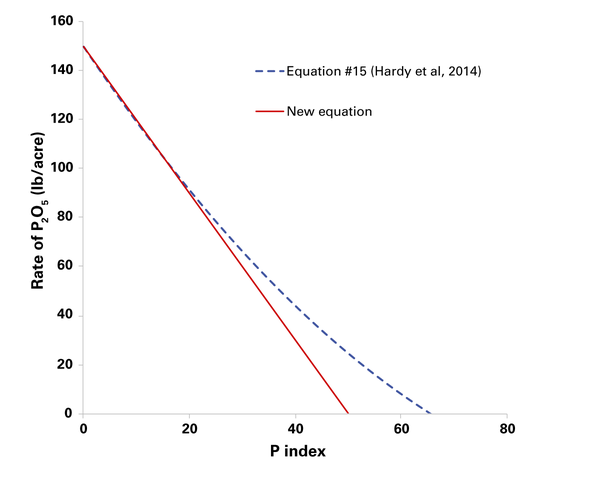
The fertilization cutoff of P-I > 50 was implemented in late summer of 2021 by changing the equation used to determine P2O5 rate. Currently, NCDA&CS recommends using equation #15 (P2O5, lb/acre = 0.0140 × P-I2 - 3.20 × P-I + 150) to estimate the P2O5 rate for corn, soybean, and small grains (Hardy et al. 2014). The committee decided to use a new equation for these crops (P2O5, lb/acre = -3.0 × P-I + 150). The comparison between both recommendations is shown in Figure 4.
Conclusions
The revised P fertilizer recommendation equation for corn, soybean, and small grain is P2O5, lb/acre = -3.0 × PI + 150. The objective is to have zero phosphorus fertilization in soils with a P-I higher than 50 because there is no yield response and it will save farmers money. This decision is supported by research data demonstrating that no response to fertilization can be expected in soils with P-I higher than 21, and responses to fertilization were never detected in soils with P-I higher than 35. If the Interagency Soil Test Phosphorus Committee’s research indicates a need for further changes, future modifications in P recommendations for North Carolina are possible.
References
Cox, F.R. and D.G. Lins. 1984. “A Phosphorus Soil Test Interpretation for Corn Grown on Acid Soils Varying in Crystalline Clay Content.” Communications in Soil Science and Plant Analysis 15, no. 12: 1481–1491.
Cox, F.R. 1992. “Range in Soil Phosphorus Critical Levels with Time.” Soil Science Society of America Journal 56, no. 5: 1504–1509.
Cox, F.R. 1996. “Economic Phosphorus Fertilization Using a Linear Response and Plateau Function.” Communications in Soil Science and Plant Analysis 27, no. 3–4: 531–543.
Cox, F.R. and J.S. Barnes. 2002. “Peanut, Corn, and Cotton Critical Levels for Phosphorus and Potassium on Goldsboro Soil.” Communications in Soil Science and Plant Analysis 33, no. 7–8: 1173–1186.
Crozier, C.R., B. Walls, D.H. Hardy, and J.S. Barnes. 2004. “Response of Cotton to P and K Soil Fertility Gradients in North Carolina.” Journal of Cotton Science 8, no. 3: 130–141.
North Carolina Department of Environmental Quality. Nonpoint Source Planning. Accessed September 2021.
Shelton, J.E., N.T. Coleman, and W.H. Rankin. 1961. “Rate of Phosphorus Required to Build up Phosphorus in a Georgeville Soil.” Soil Science Society of North Carolina. In: Proceedings of 4th Annual Meeting, 11–18.
Kamprath, E.J. 1999. “Changes in Phosphate Availability of Ultisols with Long-term Cropping.” Communications in Soil Science and Plant Analysis 30, no. 7–8: 909–919.
Kulesza, S. 2020. “Soil Test Levels of P and Zn: The Current Status in NC Soils.” In: Mid-Atlantic Soil Testing and Plant Analysis Work Group. 2020 Annual Meeting. Feb 11–12, Raleigh, NC.
Hardy, D.H., M.R. Tucker, and C.E. Stokes. 2014. Crop Fertilization Based on North Carolina Soil Tests. North Carolina Department of Agriculture and Consumer Services–Agronomic Division.
Zhang, H. et al. 2021. “Variation in Soil-test-based Phosphorus and Potassium Rate Recommendations Across the Southern USA.” Soil Science Society of America Journal 85, no. 4: 975–988.
Publication date: Oct. 28, 2021
AG-439-90
N.C. Cooperative Extension prohibits discrimination and harassment regardless of age, color, disability, family and marital status, gender identity, national origin, political beliefs, race, religion, sex (including pregnancy), sexual orientation and veteran status.


