Introduction
North Carolina farmers grow crops on over 2 million acres of poorly drained soils. Thesefields represent nearly 40 percent of the state's cropland. Cropland drainage has long been one of the most important components of land management in the coastal plain and tidewater regions of the state beginning soon after colonization more than 300 years ago (28). *
Many of these artificially drained soils are adjacent to estuaries and freshwater lakes and streams, areas that are environmentally sensitive and ecologically important. Agricultural runoff has contributed to the decline of water quality in many of the state's surface water systems (36, 45, 46, 50). As shown in Figure 1, agricultural production, tourism, recreation, and fishing contribute more than $10 billion to the state's economy and $4 billion to the economy of coastal counties. Since these important industries must coexist, future agricultural practices must be designed and managed in a way that will protect water quality.
Restrictions on land development and drainage imposed by the 1985 Food Security Act have limited the possibility of expanding farming operations by clearing and draining land. Instead, farmers are using more intensive management practices to increase yields and improve production efficiency on land already in cultivation.
* Numbers in parantheses refer to the list of references at the end of this publication. ↲
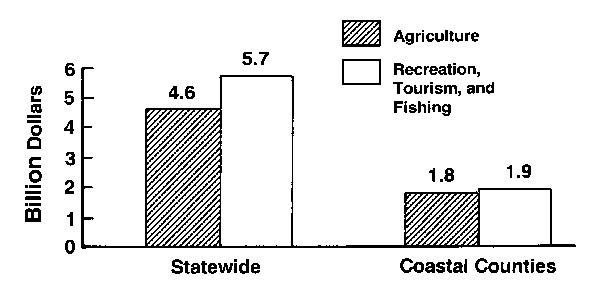
Figure 1. Contribution of agriculture, recreation, tourism, and marine fishing to the economy of North Carolina. (All values are gross direct receipts to source that is, paid to farmers, fisherman, etc.- and do not include indirect revenues such as processing, packaging, transportation, distribution, and retailing.)
Source: MC. Agricultural Statistics, USDA, 1988; North Carolina Department of Natural Resources, Division of Parks and Recreation; NC. Department of Commerce, Division of Travel and Tourism; and NC. Division of Marine Fisheries.
Water Quality Concerns
The hydrologic, biological, and chemical cycles in coastal rivers and estuaries are extremely complex. Although fresh water and nutrients are essential components of these systems (30, 40, 50), they may become unbalanced as a result of human activities. These activities include:
- damming of rivers and streams;
- discharge of municipal and industrial waste directly into rivers, streams, and estuaries;
- urban and rural development, resulting in more intense stormwater runoff that may carry nutrients and suspended solids from lawns, roads, and other paved areas;
- artificial drainage to promote agriculture and forestry;
- introduction of nutrients from agricultural fertilization and from live- stock and domestic waste:
- alteration or conversion of wetlands to other uses such as agriculture, rural and urban development, recreation, and tourism.
The environmental impacts of these activities vary with the status and circulation of the receiving water. For example, juvenile marine organisms depend on the headwaters of the estuarine system to provide shelter and food. These areas also provide natural outlets for rural and urban stormwater drains and agricultural drainage systems. Dilution of seawater by fresh water creates the medium salinity waters that produce most of the economically important species of fish and shellfish (50). Some studies have shown, however, that high outflow rates associated with intensive artificial drainage further reduce the salinity of head-waters (30, 50), sometimes resulting in stress, disease, or depressed production of certain pelagic species (surface feeders such as Atlantic menhaden) (40, 44). Other more intensive studies directed specifically at evaluating hydrodynamic effects showed that freshwater out-flow from land- based activities such as artificial drainage have little influence on estuarine salinity (51, 52, 53). Rather, salinity fluctuations were dominated by natural circulation patterns caused by tides, wind, and rainfall. Recently, freshwater outflow was found to stimulate growth of some demersal species (bottom feeders such as spot and croaker) (41, 42).
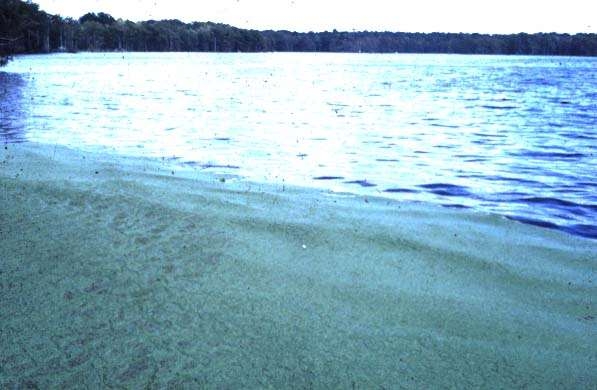
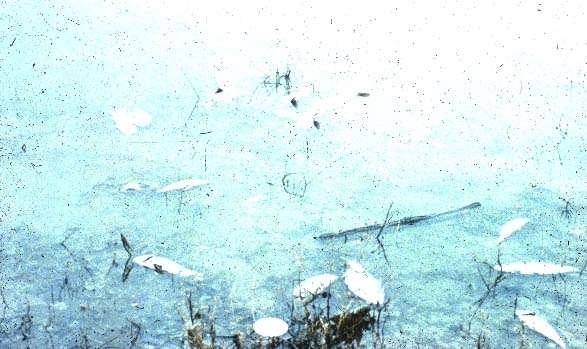
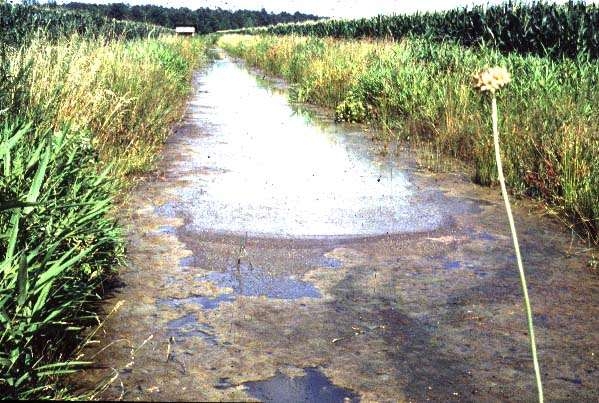
Nitrogen and phosphorus levels in many tidewater rivers, streams, and estuaries have become high enough that a very delicate balance exists between undesirable species such as blue-green algae (BOA) and other desirable flora (5, 27, 30, 31, 47, 48, 49). Typically, water bodies receiving excessive nutrient loads are most susceptible to blooms of blue-green algae. These algae are very prolific when excessive levels of nitrogen, phosphorus, or both are present (5, 27, 30, 31, 47, 48, 49). Blue-green algal dominance may alter the aquatic food chains. The algae blooms are unsightly (Figure 2) and may pose problems (such as toxicity and bad taste or odor) to recreational users of the water. They can also consume much of the dissolved oxygen, leaving the water anoxic (deprived of oxygen). This problem is more acute when the waters are stagnant or have slow circulation (48, 49). Anoxic conditions are stressful and sometimes fatal to fish, which depend on oxygen to survive (Figure 3). When fish come to the surface and gasp for air, it often indicates anoxic conditions.
Agricultural cropland is a major nonpoint source of nitrogen and phosphorus contributing to the nutrient enrichment of tidewater rivers and estuaries in North Carolina (5, 45, 46). Best Management Practices must be adopted to reduce the amount of nitrogen and phosphorus discharged to sensitive surface waters. Reductions of at least 30 percent in nitrogen and 50 percent in phosphorus have been recommended to minimize blue-green algae blooms in the Lower Neuse River during the summer months (49).
Agricultural Activities Influencing Water Quality
Many agricultural practices contribute to environmental problems. These include tillage practices, fertilizer and pesticide application methods and rates, and drainage and irrigation practices. For example, typical North Carolina nitrogen fertilization rates for corn have been between 150 and 200 pounds of nitrogen per acre annually (35). Although these rates were based on a potential grain yield of 175 to 200 bushels per acre per year, annual corn yields more typically average less than 100 bushels per acre because of soil and climatic conditions. Therefore, nitrogen fertilization rates exceed yield expectations in many years, resulting in the application of excess nitrogen that is not removed by the crop. This nitrogen is carried from the field and may cause environmental problems (20, 21, 25). Clearly, one very important Best Management Practice is to apply fertilizers at rates consistent with sustainable yields rather than potential yields.
Although several Best Management Practices can be employed to minimize the environmental impacts of crop production, this publication focuses on strategies related to water table management.
Water Table Management
Although excessive soil water is often a problem on poorly drained soils, weather conditions are extremely variable, and crops sometimes suffer from drought, which can also reduce yield. Intensive drainage systems are necessary to ensure access to many fields during wet periods. But past drainage practices have not always encouraged water conservation. As a result, these systems have tended to overdrain many areas and increase drought damage during dry growing seasons (9).
These problems are resulting in a transition from conventional drainage methods to water table management systems. The latter provide drainage during wet periods but also include control structures to manage the water level at the drainage outlet, making it possible to reduce overdrainage. In some cases, the system can be used to provide subirrigation during dry periods. Collectively, these management practices are referred to as water table management (14) and include any combination of management practices such as surface drainage, subsurface drainage, controlled drainage, or subirrigation- that influence the level of the shallow water table.
Research on the use of subirrigation and controlled drainage to provide water for crops and to meet drainage needs has been conducted in North Carolina since the early 1970s (54, 55). Using results of this research, methods and guidelines for designing drainage systems for different soils, crops, and weather conditions have been developed (10, 11, 12, 16, 19,56,57,58,61,64,65,66).
Controlled Drainage: A Best Management Practice
Studies have shown that water table management systems can improve drainage water quality when properly designed and carefully managed (7, 8, 17, 22, 23, 24, 62, 63). On the basis of these studies, water table management-in particular, controlled drainage-has been designated a Best Management Practice (BMP) for soils with improved drainage. It therefore qualifies for cost-share assistance under the North Carolina Agricultural Cost Share Program(NCACSP).
As of July 1, 1989, more than 2,500 control structures have been installed to provide controlled drainage on approximately 150,000 acres in eastern North Carolina. The North Carolina Agricultural Cost Share Program has helped bear the cost of approximately 1,800 of these water control structures. An additional 1 million acres of cropland in North Carolina are suited for controlled drainage. This acreage includes most of the cropland in the lower coastal plain and tidewater regions.
Unlike many BMPs, controlled drainage benefits both production and water quality. The production benefits make it a popular practice with farmers, while the water quality benefits help meet environmental goals.
The North Carolina Agricultural Cost Share Program is not designed to benefit agricultural production but rather to hasten the adoption of BMPs to promote soil and water conservation, provide habitat for wildlife, and protect or restore the environment through improved water quality. The NCACSP seeks these environmental benefits by providing financial incentives to those who implement controlled drainage systems.
The implementation of controlled drainage, or any other management practice, does not by itself satisfy the objectives of the North Carolina Agricultural Cost Share Program. The program's purposes are met only after the environmental concerns or problems for a given site have been taken into account and incorporated in a management strategy for that site.
For water table management or controlled drainage practices, this means taking into account any water quality problems of the receiving fresh waters or estuaries and developing management strategies that will minimize the adverse effects of drainage water flowing from agricultural lands. To do this successfully, it is necessary to know (1) about any problems in the receiving waters, (2) the characteristics of the drainage water and how specific management strategies might influence these characteristics, and (3) the subsequent impact on receiving waters.
Influence of Water Table Management on Drainage Water Quality
Precipitation and Drainage Outflow
Rainfall in eastern North Carolina averages from 46 to 56 inches annually, depending on location. Potential
evapotranspiration ranges from 38 to 41 inches, although actual evapotranspiration is typically 34 to 36 inches annually because short-term droughts often occur. Therefore, excess rainfall (the difference between rainfall and actual evapotranspiration) ranges from 12 to 20 inches annually. A small amount of this excess (usually less than 1 inch per year) percolates through the soil to recharge the deep groundwater aquifer systems (29). Most of the excess rainfall, however, eventually returns to the ocean through the surface water system of streams, rivers, estuaries, and sounds.
The rate at which rainfall leaves a site depends on rainfall intensity, topography, infiltration, soil permeability, vegetative cover, the distance from a drainage outlet, and the location of restrictive horizons. Intense rainstorms often result in surface runoff, whereas rainfall from milder storms usually infiltrates the soil. Much of eastern North Carolina is underlain by marine clay sediments at depths less than 30 feet from the soil surface (6, 29). These sediments restrict the rate of deep groundwater recharge. As a result, excess rainfall that infiltrates the soil moves laterally above them as shallow groundwater flow until it eventually discharges to the surface water system.
This process of rain, surface runoff, infiltration, evaporation, shallow groundwater flow, and deep groundwater recharge is referred to as the hydrologic cycle. Figure 4 illustrates the hydrologic cycle for eastern North Carolina. The total annual volume of outflow from a field is about the same for sites that drain well naturally, typical of the upper coastal plain and piedmont, and for those that do not, typical of the lower coastal plain and tidewater regions. The main difference is in the rate of outflow and the pathway by which excess water leaves the site. On well-drained sites, outflow occurs soon after rainfall and the flow duration is relatively short, usually a few days. On poorly drained sites, the outflow is more gradual but may last several weeks. Artificial drainage tends to convert a poorly drained site into a well-drained site.
Characteristics of Drainage Water
Excess rainfall leaves a field either as surface drainage (surface runoff) or as subsurface drainage (shallow groundwater flow). This difference is important from a water quality standpoint because the characteristics of the drainage waters differ. In practice, it is usually difficult to differentiate between surface and subsurface drainage because the outflow in drainage ditches or canals is a combination of the two. For the remaining discussion, drainage systems in which the majority of outflow has drained through the soil profile are referred to as subsurface drainage systems (14). Systems where surface runoff is the primary drainage mechanism are called surface drainage systems.
The following paragraphs summarize the characteristics of drainage water based on approximately 125 site-years of data collected at 14 locations in eastern North Carolina.
-
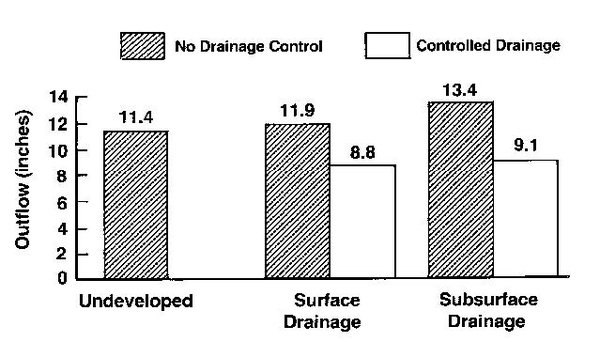
Agricultural development using artificial drainage increases total annual outflow at the field edge by 5 to 10 percent (26, 59), depending on rainfall (Figure 5). On the average, subsurface drainage increases annual outflow slightly compared to surface drainage, but the increase is usually less than 5 percent. Peak outflow rates at the field edge are lower by a factor of 1 to 4 (26, 37, 59, 60, 62), depending on the storm intensity, with subsurface drainage systems than with surface drainage systems.
-
Drainage waters from surface drainage systems contain higher concentrations of organic nitrogen, phosphorus, and sediment than those from subsurface drainage systems (8, 13, 20, 21, 24, 60). Outflow from subsurface drainage systems contains higher concentrations of nitrates than that from surface drainage systems (8, 13, 20, 21, 23, 24, 60). Both systems result in increased nutrient concentrations in drainage outflows compared to undeveloped sites (24, 26, 38), a result of fertilizer use on the developed sites.
-
Controlled drainage, when managed all year, reduces total outflow by approximately 30 percent (17, 23) compared to uncontrolled systems, although outflows vary widely depending on soil type, rainfall, type of drainage system and management intensity (8, 17, 23, 60). For example, control only during the growing season typically reduces outflow by less than 15 percent (23). The effect of controlled drainage on peak outflow rates varies seasonally. Drainage control reduces peak outflow rates during dry periods (summer and fall) but may increase peak outflow rates during wet periods (winter and spring), depending on the control strategy.
-
Drainage control has little net effect on total nitrogen and phosphorus concentrations in drainage outflow (8, 17, 22, 23). Controlled drainage may reduce nitrate-nitrogen(NO3-N) concentrations in drainage outflow by up to 20 percent, but total Kjeldahl nitrogen (TKN) concentrations are somewhat increased. Controlled drainage tends to decrease phosphorus concentrations on predominately surface systems but has the opposite effect on predominately subsurface systems (8, 17, 22, 60). Seasonal variations may also occur, depending on rainfall, soil type, and the relative contribution of surface or subsurface drainage to total outflow.
-
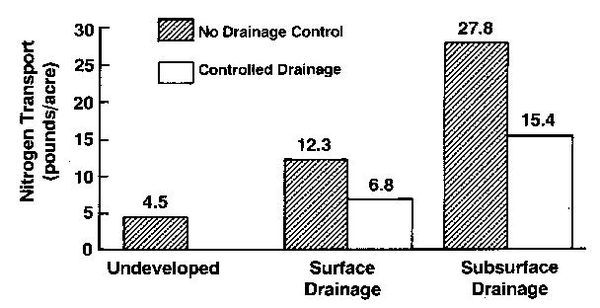
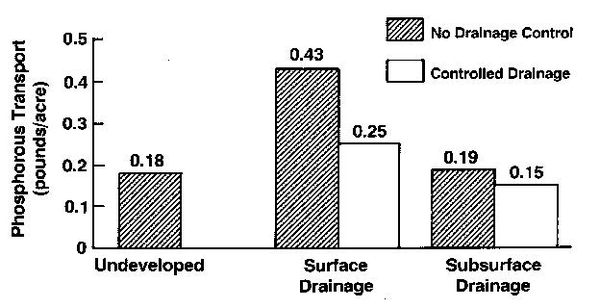
Controlled drainage reduces nitrogen and phosphorus transport at the field edge (8, 17, 22, 23, 60), primarily because of the reduction in outflow volume. In 14 field studies, drainage control reduced the annual transport of total nitrogen (NO3-N and TKN) at the field edge by 9 pounds per acre, or 45 percent (Figure 6), and total phosphorus by 0.11 pound per acre, or 35 percent (Figure 7). Again, the reductions at individual sites were influenced by rainfall, soil type, type of drainage system, and management intensity.
Effects of Artificial Drainage on Receiving Waters
Agricultural development slightly increases the total volume of flow reaching the receiving surface water system in coastal areas. Drainage reduces the time that excess rainfall remains on site before it reaches the receiving system, resulting in higher outflow rates (more water over a shorter time) than from undeveloped sites. However, in modeling studies (37) peak outflow rates reaching receiving streams were lower than peak outflow rates at the field edge. The impact on the receiving waters of these hydrologic changes is still unclear, but it almost certainly depends on the drainage network and circulation of the receiving water.
From a water quality standpoint, the most dramatic effect of agricultural development is a significant increase in nutrient concentrations in drainage water and nutrient transport from fields. This increase is not a direct consequence of drainage activities; rather, it results from fertilization and other production activities made possible by improved drainage. The net effect of fertilization combined with artificial drainage is an increase in nitrogen and phosphorus reaching coastal waters. However, the amounts reaching receiving waters are less than the amounts leaving the field edge (2, 3, 4, 20, 32, 33, 34) because some of the nitrogen and phosphorus is assimilated and removed en route by natural mechanisms.
Any management strategy that can help keep nutrients on site and prevent them from reaching sensitive receiving surface waters is a positive step. However, to be effective these strategies must reduce nitrogen by 30 to 40 percent and phosphorus at least this much (47, 48, 49). Smaller reductions may not adequately improve water quality.
The transport of nitrogen and phosphorus from artificially drained fields can be minimized by applying fertilizers at a rate consistent with sustainable yields, selecting the appropriate water management system (such as controlled drainage), and properly managing that system.
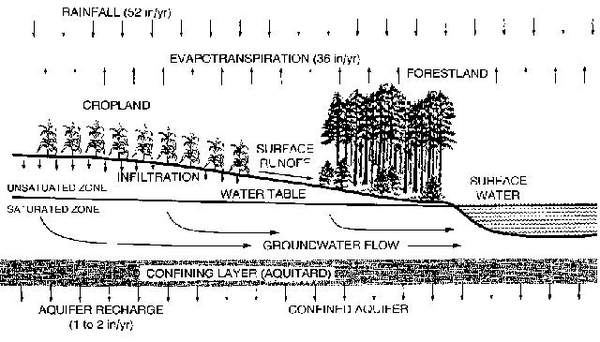
Figure 4. Typical hydrologic cycle for eastern North Carolina. East of I-95 (which parallels the fall line between the coastal plain and the piedmont) average annual rainfall ranges from 46 to 56 inches, depending on location. Actual evaporation ranges from 34 to 36 inches annually.
Therefore, the "excess" rainfall, most of which returns to surface waters, ranges from 12 to 20 inches per year.
Management Considerations and Guidelines
The successful management of controlled drainage systems rests on two important objectives. The first is achieving optimum production efficiency (15); the second is attaining maximum water quality benefits (18). In selecting the best management strategy from the standpoint of water quality, the characteristics of the receiving surface waters must be considered. For coastal rivers and streams, the primary concern is eutrophication. The management strategy should therefore effectively reduce the transport of nitrogen and phosphorus in drainage water. The condition of the receiving waters will determine whether it is more important to reduce nitrogen or phosphorus, or whether it is necessary to reduce both. In estuaries, nutrients and freshwater inflow (resulting from peak drainage outflow rates) are the primary concerns.
Management Considerations
The question most frequently asked by farmers, yet the one most difficult to answer is: At what depth should the water table be controlled? In humid regions, there is no "optimum depth because the water table may fluctuate several inches from day to day in response to such variables as rainfall, evapotranspiration, and drainage. Williamson and Kriz (1970) report that a wide range of water table depths (1 to 4 feet) will result in optimum yields for many crops, depending on soil type, profile layers and their hydraulic properties, weather conditions, type of crop, crop development, and rooting depth. The starting point recommended for the sandy loam soils of North Carolina is 2 feet (12, 1S, 64). Most crops can readily tolerate a 6-inch increase or decrease in the water table. Although not well documented, experience has shown that short- term fluctuations in the water table will not reduce the yield on most soils provided that the water table depth does not undergo long periods (typically 24 hours or more) at a depth less than 1 foot or greater than 3 feet.
Information in earlier sections suggests that total drainage outflow could be decreased (to levels near those of undeveloped sites) if the control elevation is raised to the soil surface. Since nutrient transport has been shown to be nearly proportional to drainage outflow, minimizing outflow would minimize the potential transport of fertilizer nutrients. In addition, very high water table elevations during the growing season may increase the potential loss of nitrogen by denitrification (21), thus reducing the nitrate levels in drainage outflow. While this situation might be desirable from a water quality standpoint, it would not be desirable for crop production. Thus, some compromise in potential water quality benefits is necessary to maintain productivity, although the compromise for water quality is not nearly as severe as might be expected.
Nitrate concentrations in drainage water could be reduced by keeping the water elevation as high as possible in the outlet ditch and subsequently in the field. However, doing so would increase the transport of phosphorus by increasing the proportion of surface runoff in total flow. Although total outflow would be reduced (usually less than S percent), there would be an increase in peak flows of shorter duration (a property of surface runoff), which would be likely to cause salinity fluctuations near primary nursery areas. Furthermore, a shallow field water table would restrict root growth and development (39), thereby reducing evapotranspiration (26) and nutrient uptake, leading in turn to increased losses in drainage water. Thus, most water table management strategies aimed at improving production on cropland also have a positive effect on drainage water quality. The primary difference between the two management objectives is that management during the non-growing season is also beneficial for water quality (22, 23, 60).
Another important consideration involving water table management, production, and water quality is trafficability, which is essential for efficient production. Farmers may severely impair the production potential of their fields by trying to till the soil when it is too wet. With improved drainage, tillage can begin sooner after rainfall. For example, the wet spring of 1989 presented serious trafficability problems for many North Carolina farmers. Because of poor traffficability, less than 50 percent of the acreage planned for corn was actually planted. However, most fields with good artificial drainage were planted on time.
In some cases, farmers have attempted to resume tillage operations too soon after rains stop. In doing so, they may damage the soil structure and promote the development of tillage pans (43), thereby increasing surface runoff and reducing infiltration, root development, and evapotranspiration. These effects are undesirable for crop production and also adversely affect drainage water quality. This problem occurs most frequently on soils with a clayey subsoil and a shallow sandy loam or loamy sand surface horizon less than 2 feet thick (43). The problem may be compounded by controlled drainage if farmers are reluctant to lower the control elevation. Many times this problem is not apparent during tillage because there is no immediate trafficability problem, particularly with high-flotation equipment.
The interaction between water table management, trafficability, and the development of tillage pans has not been studied extensively. Farmers in North Carolina have not experienced any apparent trafficability problems when the water table was at least 3 feet deep (12). Based on this information, farmers have been encouraged to lower the water control elevation to at least 3 feet deep two days or more before beginning tillage operations. In some cases, the soil can bear traffic when the water table is about 2 feet deep. However, the effect on the development of tillage pans or impairment of soil structure is not known.
Management Guidelines
Controlled drainage in North Carolina has predominantly been practiced with a crop rotation of corn, wheat, and soybeans, although increasing acreages of potatoes, peanuts, and vegetable crops are being included. Table 1 summarizes a recommended management strategy for a two-year rotation of corn, soybeans, and wheat; this strategy is designed to improve both production and drainage water quality. The values shown are weir elevations of the control structure relative to average soil surface elevations. Water table levels in the field may be considerably different from the weir elevation, depending on whether the system is in a drainage or recharge cycle; however, the values shown are also the average target elevations of the water table in the field.
Table 1. General Water Table Management Guidelines to Promote Water Quality and Optimum Crop Yields for a Two-Year Rotation of Corn-Wheat-Soybeans
Most of the control elevation adjustments shown in Table 1 are related to trafficability and seasonal fluctuations in rainfall. For example, during a wet spring (April and May), the weir elevation should be approximately 1 foot lower than the values shown to improve trafficability; increase potential storage for infiltration; and reduce the potential for surface runoff, sediment and phosphorus transport, and higher peak outflow rates.
During summer months, evapotranspiration will usually cause the water table in the field to decline to an elevation considerably below that of the weir unless water is added to the system by subirrigation. Intense summer thunderstorms sometimes exceed the infiltration rate of the soil, resulting in loss of much- needed water by surface runoff. Under these circumstances, the weir elevation can be raised temporarily to retain this water in the field ditches, from which it will then move back into the field by subsurface flow. However, if the water level in the field ditches has not receded to at least 1 foot within 24 hours, lower the weir elevation to the suggested levels shown in Table 1.
To prevent serious crop damage from heavy rainfall, do not raise weirs in the outlet ditch above 1 foot and leave them unattended for more than 24 hours during the growing season. When adjusting the weir level to remove excess water, never lower it more than 6 inches within a 12-hour period because the ditch banks will be saturated and may be unstable. Lowering the water level too quickly may result in sloughing and erosion of the banks. Also, lowering the weir in small increments minimizes peak outflow rates.
The primary benefit of controlled drainage in lands that discharge to freshwater rivers and streams is a reduction of total outflow and nutrient loading. These goals can be accomplished by setting the weir at a specified level and making minor adjustments to accommodate production requirements, as shown in Table 1. Without attentive management, the potential production and water quality benefits of drainage control will not be realized. Controlled drainage and subirrigation systems are normally designed with closer drain spacings than conventional drainage systems to provide the drainage capacity needed for traffficability and crop protection when the water table is elevated. As a result, drainage outflow rates and nutrient transport can be significantly greater than those from conventional systems if the system is not properly monitored.
As discussed earlier, operating a controlled drainage system with a constant weir elevation will reduce outflow rates during recharge periods but will sometimes increase outflow rates during discharge periods. Thus, if drainage waters are discharged near estuarine areas, the weir elevation must be more intensively managed if peak outflow rates are to be reduced during the critical spring period.
All water table management systems function primarily in the drainage mode during the spring when water table elevations are high and rainfall exceeds evaporation. Peak outflow rates are usually higher during this period because of the higher water table elevations resulting from controlled drainage. To reduce peak outflow rates and minimize surface runoff by draining the soil between rains, set the weir elevation at or near the soil surface when rainfall is anticipated or forecast. After the rainfall and as soon as all surface water has infiltrated, lower the weir elevation gradually (about 6 inches per day) to its lowest possible elevation or until the next rainfall. This strategy will allow the soil profile to drain gradually but uniformly and will also provide soil storage capacity in preparation for the next rainfall. Management at this level of intensity is necessary from late February to May. During the remainder of the year, the procedures outlined in Table 1 can be followed.
The potential for reducing peak outflow rates by means of this intensive management strategy is not known, but it is believed that outflow rates at the field edge can be reduced to approximately one- half of those for conventional control strategies. The major disadvantage is the greater attention that must be given to managing the system, especially during the non-growing season.
Monitoring the System
The water table elevation in the field may be considerably different from the water level in the outlet ditches or the weir elevation. From the standpoint of crop production, the water table level in the field is the important consideration. Intensive management of these systems is required for both production and water quality because many of the management indicators are hidden from view and the response to weir adjustments is not usually immediate.
The response time for water table fluctuations in the field may be several days longer than for similar fluctuations in the outlet ditch. For example, during the summer the water table in the field sometimes drops below 5 feet. At this depth, most soils in the tidewater region can store 2 to 4 inches of rainfall. Yet, as discussed previously, a 2-inch intense thunderstorm may result in surface runoff and outflow. Based on outflow at the control structure, one would assume that the soil was saturated. However, after soil moisture redistribution, the water table may rise only to 3 feet, which in many soils is not high enough to supply the crop's water needs. Thus observation wells that allow the level of the field water table to be observed are essential for proper system management. Recommendations for the construction, location, and installation of observation wells have been reported, as have suggestions for monitoring frequency (12, 15).
Be a Steward of Your Soil and Water Resources
Although agricultural activities have undoubtedly contributed to coastal water problems, they are not the only source of these problems. Society has been slow to recognize that freshwater and estuarine ecosystems have a limited capacity to absorb waste products produced by human activities. Likewise, more efficient harvesting methods, especially the non-selective methods practiced over the past two decades, have recognized the production and self-stocking capacity of the estuarine system. The problems that now exist in coastal waters did not develop overnight; they are the cumulative effects of man's activities over many years. For example, although nutrient levels in the Chowan River reached levels conducive to blue- green algae blooms by the mid-1950s (1), the first significant nuisance bloom did not occur until 1972, nearly 20 years later.
Similarly, coastal water problems cannot be corrected overnight. Nutrient- enriched sediment can now be found at the bottom of many streams, rivers, and estuaries (47), resulting from many decades of agricultural, municipal, and industrial discharges. As a consequence, it will take coastal waters several years to cleanse themselves through natural biological, chemical, and flushing processes.
Implementing Best Management Practices on farms may not immediately produce visible improvement in the coastal environment, but it will begin to reverse the damage. The first step is to reduce inputs so that the receiving systems can beg in to cleanse themselves. By integrating good water management with other Best Management Practices, such as reducing fertilization rates to the minimum levels needed for reliable yields, we may be able to achieve drainage water quality similar to that of undeveloped sites. Equally important, attaining the target yields for which fertilizer rates are chosen also requires proper water management. Agriculture's harmful impacts on the coastal water environment can be significantly reduced, but only when all landowners and producers exercise stewardship of land and water resources.
Thus far, Best Management Practices for soil and water conservation and environmental protection have been implemented on a voluntary basis, supported by incentive programs such as the North Carolina Agricultural Cost Share Program. However, with the passage of the swampbuster and sodbuster provisions of the 1985 Farm Bill, Congress demonstrated that it is not deaf to continuing pleas to protect the environment through regulations. Farmers still have the opportunity to implement practices such as controlled drainage voluntarily. But without conscientious attention to such practices, future implementation may become mandatory and financial incentives may be removed.
If water quality is to be improved, water control structures must be managed throughout the year, not just during the growing season. This means raising the weir level to within 12 to 18 inches of the soil surface after the crop has been harvested instead of leaving the flashboards lying on the ditch bank over the winter.
Strategies for water table management are complex. To ensure maximum production and water quality benefits from controlled drainage, seek professional advice. Staff members of the North Carolina Agricultural Extension Service and the Soil Conservation Service in each county have been trained in water management and can recommend strategies for efficient operation.
References Cited
- Bond, S., G. Cook, and D. H. Howells. (1979). Summary report: The Chowan River Project. North Carolina Water Resources Research Institute, Raleigh. 36 p.
- Cooper, J. R. 1985. Phosphorus and sediment redistribution from cultivated fields into riparian areas. Ph.D. dissertation., North Carolina State University, Raleigh. 181 p.
- Cooper, J. R., and J. W. Gilliam. 1987. Phosphorus redistribution from cultivated fields into riparian areas. Soil Science Society of America 51(6): 1600-1604.
- Cooper, J. R., J. W. Gilliam, R. B. Daniels, and W. R. Robarge. 1987. Riparian areas as filters for agricultural sediment. Soil Science Society of America 51(2):416-420.
- Craig, N. J., and E. J. Kuenzler. 1983. Land use, nutrient yield and eutrophication in the Chowan River basin. Report no. 205. Water Resources Research Institute of North Carolina, Raleigh. 69 p.
- Daniels, R. B., H. J. Kleiss, S. W. Boul, H. J. Byrd, and J. A. Phillips. 1984.Soil Systems in North Carolina. Bulletin 467. North Carolina Agricultural Research Service. 77 p.
- Deal, S. C. 1984. Ph.D. thesis. North Carolina State University. Raleigh. 117 p.
- Deal, S. C., J. W. Gilliam, R. W. Skaggs, and K. D. Konyha. 1986. Prediction of nitrogen and phosphorus losses as related to agricultural drainage system design. Agriculture, Ecosystems and Environment, 18:37-51.
- Doty, C. W., J. E. Parsons, A. Nassehzadeh-Tabrizi, R. W. Skaggs, and A. W. Badr. 1982. Deep ditch overdrainage affects water table depth and crop yield. Proceedings of the Specialty Conference "Environmentally Sound Water and Soil Management." American Society of Civil Engineers, Orlando, Fla. pp. 113-121.
- Doty, C. W., J. E. Parsons, A. Nassehzadeh-Tabrizi, R. W. Skaggs, and A. W. Badr. 1984. Stream water levels affect field water tables and corn yields. Transactions of the American Society of Agricultural Engineers 27(5): 1300-1306.
- Doty, C.W., J.E.Parsons,A.W. Badr, A. Nassehzadeh-Tabrizi, and R. W. Skaggs. 1985. Water table control for water resource projects on sandy soils. Journal of Soil and Water Conservation 40(4):360- 364.
- Doty, C. W., R. O. Evans, R. D. Hinson, H. J. Gibson, and W. B. Williams. 1986. Agricultural water table management: A guide for eastern North Carolina. U.S. Department of Agriculture, Soil Conservation Service and Agricultural Research Service, North Carolina Agricultural Research Service, and North Carolina Agricultural Extension Service, Raleigh. 205 p.
- Evans, R. O., P. W. Westerman, and M. R. Overcash. 1984. Drainage water quality from land application of swine lagoon effluent. Transactions of the American Society of Agricultural Engineers 27(2):473-480.
- Evans, R. O. and R. W. Skaggs. 1985a. Agricultural water table management for coastal plain soils. Publication AG-355. North Carolina Agricultural Extension Service, Raleigh. 12 p.
- Evans, R. O. and R. W. Skaggs. 1985b. Operating controlled drainage and subirrigation systems. Publication AG-356. North Carolina Agricultural Extension Service. Raleigh. 12 p.
- Evans, R. O., R. W. Skaggs, and R. E. Sneed. 1988. Economics of controlled drainage and subirrigation systems. Publication AG-397. North Carolina Agricultural Extension Service, Raleigh. 20p.
- Evans, R. O., J. W. Gilliam, and R. W. Skaggs. 1989a. Effects of agricultural water table management on drainage water quality. Report no. 237. North Carolina Water Resources Research Institute. Raleigh. 87 p.
- Evans, R. O., J. W. Gilliam, and R. W. Skaggs. 1989b. Managing water table management systems for water quality. ASAE Paper 89-2129. 24 p.
- Evans, R. O., and R. W. Skaggs. 1989. Design guidelines for water table management systems on coastal plain soils. Applied Engineering in Agriculture 5(4):539-548.
- Gambrell, R. P., J. W. Gilliam, and S. B. Weed. 1974. The fate of fertilizer nutrients as related to water quality in the North Carolina coastal plain. Report no. 93. North Carolina Water Resources Research Institute, Raleigh. 151 p.
- Gambrell, R. P., J. W. Gilliam, and S. B. Weed. 1975. Nitrogen losses from soils of the North Carolina coastal plain. Journal of Environmental Ouality 4(3): 317-323.
- Gilliam, J. W., R. W. Skaggs, and S. B. Weed. 1978. An evaluation of the potential for using drainage control to reduce nitrate loss from agricultural fields to surface waters. Tech. Report no. 128. North Carolina Water Resources Research Institute, Raleigh. 108 p.
- Gilliam, J. W., R. W. Skaggs, and S. B. Weed. 1979. Drainage control to reduce nitrate loss from agricultural fields. Journal of Environmental Ouality 8(1): 137-142.
- Gilliam, J. W., and R. W. Skaggs. 1985. Use of drainage control to minimize potential detrimental effects of improved drainage systems. In:Proceedings of the Specialty Conference "Development and Management Aspects of Irrigation and Drainage Systems." Ir Div., ASCE. pp. 352-362.
- Gilliam, J. W. 1988. Mtrate in North Carolina ground water. Proceedings of the Soil Science Society of North Carolina. Raleigh. Vol. 31, pp 70-78.
- Gregory, J. D., R. W. Skaggs, R. G. Broadhead, R. H. Culbreath, J. R. Bailey, and T. L. Foutz. 1984. Hydrologic and water quality impacts of peat mining in North Carolina. Report no. 214. North Carolina Water Resources Research Institute, Raleigh. 215 p.
- Harrison, W. G., and J. E. Hobbie. 1974. Nitrogen budget of a North Carolina estuary. Report no. 86. North Carolina Water Resources Research Institute, Raleigh. 172 p.
- Heath, R. C. 1975. Hydrology of the Albemarle-Pamlico region of North Carolina. USGS Water Resources Investigation 9-75. 98p.
- Heath, R. C. 1980. Basic elements of groundwater hydrology with reference to conditions in North Carolina. U.S.Geological Survey, Water Resources Investigations, Open-File Report no. 80-44. 87 p.
- Hobbie, J. E., B. J. Copeland, and W. G. Harrison. 1972. Nutrients in the Pamlico River estuary, N.C., 1969-1971. Report no. 76. North Carolina Water Resources Research Institute, Raleigh. 242 p.
- Hobbie, J. E. 1974. Nutrients and eutrophication in the Pamlico River estuary, North Carolina, 1971- 1973. Report no. 100. North Carolina Water Resource Research Institute, Raleigh.239 p.
- Jacobs, T. C., and J. W. Gilliam. 1983. Nitrate loss from agricultural drainage waters: implications for nonpoint source control. Report no. 209. North Carolina Water Resource Research Institute, Raleigh. 99 p.
- Jacobs, T. C., and J. W. Gilliam. 1985a. Headwater stream losses of nitrogen from two coastal plain watersheds. Journal of Environmental Quality 14(4): 467-472.
- Jacobs, T. C., and J. W. Gilliam. 1985b. Riparian losses of nitrate from agricultural drainage waters. Journal of Environmental Quality 14(4):472-478.
- Kamprath, E. J. 1986. Nitrogen studies with corn on coastal plain soils. Technical bulletin no. 282. North Carolina Agricultural Research Service. Raleigh. 15 p.
- Kirby-Smith, W. W., and R. T. Barber. 1979. The water quality ramifications in estuaries of converting forest to intensive agriculture. Report no. 148. North Carolina Water Resources Research Institute, Raleigh. 70 p.
- Konyha, K. D., R. W. Skaggs, and J. W. Gilliam. 1988. Hydrologic impacts of agricultural water management. In: The Ecology and Management of Wetlands. Vol. 2. pp 148-159.
- Kuenzler, E. J., P. J. Mulholland, and L. A. Ruley. 1977. Water quality in North Carolina coastal plain streams and effects of channelization. Report no. 127. North Carolina Water Resources Research Institute, Raleigh.160 p.
- McDaniels, V., and R. W. Skaggs. 1988. Corn root response to high water tables. ASAE Paper No. 88- 2609. 15 p.
- Miller, J. M. 1985. Effects of freshwater discharges into primary nursery areas for juvenile fish and shellfish: criteria for their protection. In: W. Gilliam, J. Miller, L. Pietrafesa, and W. Skaggs, Water Management and Estuarine Nurseries. UNC Sea Grant Publication no. UNC-SG- WP-85-2. pp. 62-84.
- Miller, J. M., B. M. Currin, and M. L. Moser. 1988. Broad Creek report - Faunal studies. In: M. F. Overton, J. S. Fisher, J. M. Miller, and L. J. Pietrafesa, Freshwater Inflow and Broad Creek Estuary, North Carolina. UNC Sea Grant Special Report. pp. 213-247.
- Moser, M. L. 1987. Effects of salinity fluctuation on juvenile estuarine fish. Ph.D. dissertation. North Carolina State University, Raleigh. 150 p.
- Naderman, G. C. 1985. Subsurface compaction and subsoiling in North Carolina. Publication AG-353. North Carolina Agricultural Extension Service, Raleigh.20p.
- Noga, E. J., M. J. Dykstra, and J. F. Levine. 1989. Fish diseases of the Albemarle-Pamlico Estuary. Report no. 238. North Carolina Water Resources Research Institute, Raleigh. 81 p.
- NRCD. 1982. Chowan River water quality management plan. Division of Environmental Management, North Carolina Department of Natural Resources and Community Development, Raleigh.
- NRCD. 1987. Surface water quality concerns in the Tar- Pamlico River basin. Report no. 87-04. Division of Environmental Management, North Carolina Department of Natural Resources and Community Development. Raleigh.
- Paerl, H. W. 1982. Environmental factors promoting and regulating N2 fixing blue-green algal blooms in the Chowan River, N.C. Report no. 176. North Carolina Water Resources Research Institute, Raleigh. 76 p.
- Paerl, H. W. 1983. Factors regulating nuisance blue-green algal bloom potentials in the Lower Neuse River, N.C. Report no. 188. North Carolina Water Resources Research Institute, Raleigh. 48 p.
- Paerl, H. W. 1987. Dynamics of blue-green algal (Microcystis aeruginosa) blooms in the Lower Neuse River, North Carolina: Causative factors and potential controls. Report no. 229. North Carolina Water Resource Research Institute, Raleigh.164 p.
- Pate, P. P., and R. Jones. 1981. Effects of upland drainage of estuarine nursery areas of Pamlico Sound, North Carolina. Working paper no. 81-10. UNC Sea Grant, Raleigh. 25 p.
- Pietrafesa, L. J. 1985. Response of Rose Bay to freshwater inputs. In: W. Gilliam, J. Miller, L. Pietrafesa, and W. Skaggs, Water Management and Estuarine Nurseries. UNC Sea Grant publication no. UNC-SG-WP-85-2. pp. 21-61.
- Pietrafesa, L. J., G. S. Janowitz, T. Y. Chao, R. H. Weisberg, F. Askari, and E. Noble. 1986. The physical oceanography of Pamlico Sound. UNC Sea Grant publication. UNC-WP-86-5. 125 p.
- Pietrafesa, L. J., F. Askari, and C. Gabriel. 1988. On salinity fluctuations in Broad Creek. In: M. F. Overton, J. S. Fisher, J. M. Miller, and L. J. Pietrafesa, Freshwater Inflow and Broad Creek Estuary, North Carolina. UNC Sea Grant Special Report. pp. 62-212.
- Skaggs, R. W., and G. J. Kriz. 1972. Water table control and subsurface irrigation in mineral and high organic coastal plain soils. Report no. 67. North Carolina Water Resources Research Institute, Raleigh. 63 p.
- Skaggs, R. W., G. J. Kriz, and R. Bernal. 1972. Irrigation through subsurface drains. Journal of the Irrigation and Drainage Division, ASCE 90:363-373.
- Skaggs. R. W. 1973. Water table movement during subirrigation. Transactions of the American Society of Agricultural Engineers 16(5):988-993.
- Skaggs, R. W. 1978. A water management model for shallow water table soils. Report no. 134. North Carolina Water Resources Research Institute, Raleigh. 178 p.
- Skaggs, R. W. 1980. A water management model for artificially drained soils. Technical bulletin no. 267, North Carolina Agricultural Research Service, Raleigh. 54 p.
- 59. Skaggs, R. W., J. W. Gilliam, T. J. Sheets, and J. S. Barnes.1980. Effect of agricultural land development on drainage waters in the North Carolina Tidewater Region. Report no. 159. North Carolina Water Resources Research Institute, Raleigh, 164 p.
- Skaggs, R. W., and J. W. Gilliam. 1981. Effect of drainage system design and operation on nitrate transport. Transactions of the American Society of Agricultural Engineers 24(4)929-934, 940.
- Skaggs, R. W. 1982. Field evaluation of a water management simulation model. Transactions of the American Society of Agricultural Engineers 25(3): 666-674.
- Skaggs, R. W., and A. Nassehzadeh-Tabrizi. 1982. Effect of drainage system design on surface and subsurface runoff from artificially drained lands. Proceedings of the Inst. Symposium on Rainfall- Runoff Modeling. Mississippi State University, Mississippi State, Miss. pp. 337-354.
- Skaggs, R. W., A. Tabrizi, and G. R. Foster. 1982. Subsurface drainage effects on erosion. Journal of Soil and Water Conservation 37(3): 167-172.
- Skaggs, R. W., and A. Tabrizi. 1983. Optimum drainage for corn production. Technical bulletin no. 274. North Carolina Agricultural Research Service, Raleigh.41 p.
- Skaggs, R. W., and A. Tabrizi. 1986. Design drainage rates for estimating drain spacings in North Carolina. Transactions of the American Society of Agricultural Engineers 29(6):1631-1640.
- Skaggs, R. W., R. O. Evans, and A. Tabrizi. 1989. Short cut methods for the design of subirrigation systems. Transactions of the American Society of Agricultural Engineers (in review).
- Williamson, R. E., and G. J. Kriz. 1970. Response of agricultural crops to flooding, depth of water table and soil gaseous composition. Transactions of the American Society of Agricultural Engineers 13(2):216-220.
Publication date: June 1, 1996
Reviewed/Revised: July 26, 2024
AG-443
N.C. Cooperative Extension prohibits discrimination and harassment regardless of age, color, disability, family and marital status, gender identity, national origin, political beliefs, race, religion, sex (including pregnancy), sexual orientation and veteran status.

