
Dairy manure and dairy wastewater are excellent sources of nutrients for most agronomic, horticultural, and silvicultural crops. Proper management of these manures as nutrient sources is critical to promoting optimum plant growth and yield while protecting the environment. Optimum management of this resource includes:
- Handling and treating manure and wastewater properly
- Testing soil and manure regularly
- Using realistic yield goals
- Applying manure in a uniform and timely fashion
Operation Size
Any operation with 100 or more confined cattle falls under the regulatory purview of the North Carolina Department of Environmental Quality and must comply with the North Carolina Cattle General Permit. A Certified Animal Waste Management Plan (CAWMP) written by a Certified Technical Specialist is required for the management of waste generated on the farm and land area needed to agronomically utilize these byproducts. The CAWMP is based on the number and type of animals on the facility, crop rotations, realistic yields, and realistic nitrogen application rates. The total acreage needed is a function of the amount of nutrients produced on the farm and the nutrients needed to obtain realistic yields per acre.
Nutrient Content of Dairy Manures
The average values of primary macronutrients (nitrogen, phosphorus, and potassium) can be found on the Manure Nutrient Content section of the North Carolina Nutrient Management website. Table 1 shows the average secondary macronutrients (Ca, Mg, and S) and micronutrient values for various dairy manure types. Because nutrient values vary considerably, it is important to have a current waste analysis to determine appropriate application rates. Because of the nature of manure slurry systems, it may not always be possible to have a sample analyzed prior to land application. However, waste analysis results received after the slurry application will indicate whether there is a need for supplemental fertilizer. Samples can be sent to the North Carolina Department of Agriculture & Consumer Services (NCDA&CS), Agronomic Division, Plant and Waste Analysis Lab, P.O. 1040 Mail Service Center, Raleigh, NC 27699-1040. Fees for analysis can be found on the North Carolina Department of Agriculture & Consumer Services website. Many private laboratories can also perform manure analyses (fees vary). If lime is added to the bedding material or you suspect the waste has acid neutralizing value, a calcium carbonate equivalence (CCE) test should be requested. There is an extra fee for this analysis if sent to NCDA&CS.
Table 1. Secondary nutrient and micronutrient content of dairy manures.
| Manure Type |
NCDA&CS Waste Code |
Ca | Mg | S | Na | Fe | Mn | B | Zn | Cu |
|---|---|---|---|---|---|---|---|---|---|---|
| Liquid slurry (lb/1,000 gallons) | LSD | 5.13 | 2.41 | 1.06 | 3.02 | 1.05 | 0.07 | 0.01 | 0.11 | 0.04 |
| Surface Scraped/Stockpiled (lb/ton) | SSD | 9.71 | 4.24 | 1.60 | 1.81 | 1.88 | 0.12 | 0.01 | 0.12 | 0.03 |
| Composed Manure (lb/ton) | FCD | 11.10 | 3.86 | 1.83 | 2.89 | 3.11 | 0.16 | 0.01 | 0.12 | 0.03 |
Source: North Carolina Department of Agriculture & Consumer Services
Because the accuracy of the analysis depends on a representative sample, take several subsamples from different locations in the manure pile or the lagoon and mix them together in a plastic bucket. After mixing the subsamples in the bucket, place approximately 3/4 of a pint of the manure material in a nonmetallic, flexible container, leaving some air space for gas expansion. If possible, refrigerate or ice the sample, and deliver it to the lab promptly. Never send waste samples in glass containers.
Samples of liquid manure slurries are more difficult to obtain because the manure basin must be thoroughly agitated before a representative sample can be taken. For liquid manure slurry systems, take samples as the slurry material is being pumped out of the lagoon. The agitation caused by the removal of the slurry will provide a representative sample. Sample results will be received after application has occurred. This increases the risk of over application of N or other nutrients. Therefore, it is important to use past results to make application decisions. Lower application rates may be necessary to avoid over application, which could result in a violation of the state general permit.
Land Application
Nutrient Availability
Only a portion of the nutrients in dairy manure are available immediately after application for use by the crop. Some of the nutrients are part of the manure's organic structure and require soil microbial activity to release them. In general, only 40 to 60 percent of the nitrogen becomes available to a crop during the year of application, depending on application method.
Ammonium and urea are the readily available forms of nitrogen that are present in many manures. Both of these forms, however, can change into ammonia, a gaseous form of N which is readily lost to the atmosphere through a process called ammonia volatilization. When surface-applied manure is not incorporated for one month or longer, as much as 75 percent of the ammonia can be lost to the atmosphere. Incorporating the manure within 48 hours reduces losses to about 25 percent, and with direct soil injection, all but 5 percent of the ammonia is retained.
Coefficients are used to estimate nutrient availabilities and to account for different manure types and methods of land application. These "availability coefficients" are multiplied by the total nutrient concentration for each element as reported in the manure analysis report or, if no sample was taken or no analysis is available, they are multiplied by the average manure values listed on the Nutrient Management Website. This value represents the nutrients available to plants. Availability coefficients are also listed on the Nutrient Management Website. If manure samples are sent to NCDA&CS Agronomic Division for analysis, reports will show plant-available nutrients in the bottom section of the waste analysis report using these availability coefficients. See Figure 1 for an example waste report. It is important to remember that all facilities under the State Cattle General Permit must collect a waste sample within 60 days of application.
Application Rate
Land application rates should be based on the nutrient requirements of the crop being grown because if annual applications overapply nutrients, environmental impacts can occur and cost producers money. Manure can be applied at a rate to supply any of the recommended nutrients. Be careful, however, that the application rate chosen to meet one specific nutrient requirement does not result in either excessive or inadequate application of other nutrients that can negatively impact water quality or the crop's health. Because manure usually does not contain the optimum nutrient balance required for each field, be sure to check the soil test recommendations for each nutrient and, if necessary, supplement with commercial fertilizer as needed. Alternative management strategies should be implemented before this occurs.
In most cases, dairy producers use manure to supply the nitrogen requirements of their crops. Nitrogen recommendations for various crops can be found using the Realistic Yield Expectations Tool. Using your county and the predominant soil type within your field, a table is generated of common crops grown in North Carolina and their respective nitrogen recommendations (Realistic Nitrogen Rate). Alternatively, the application rate can be adjusted to match the yield capability of each field by multiplying the yield from five years of field yield records by the nitrogen factor.
Applying more nitrogen than is required for the crop usually does not increase yield and can potentially contribute to nitrate contamination of groundwater and to elevated nitrate concentrations in forages. Nitrogen recommendations given on North Carolina soil test reports are not based on the soil sample submitted or the yield capabilities of an individual field or farm, so it is important to use the Realistic Yields Expectation Tool to determine application rates.
Besides monitoring nutrients, it is important to maintain an adequate soil pH. Optimum soil pH promotes good yields, nutrient availability, and manure decomposition. When dairy manure is applied at agronomic rates, high salinity (excessive soil salts concentration) has not been a problem, given the amounts of rainfall normally received in North Carolina which helps flush them out of the soil.
The most recently applied manure is not the only source of nutrients; in most fields, some nutrients are available from previous manure applications or previous legume crops. With the exception of nitrogen, updated soil tests are the best means of determining nutrient reserves from these sources. Table 2 can be used to estimate the available nitrogen carryover from legumes.
Table 2. Anticipated ranges of nitrogen returned to the soil after legume crops.
| Legume | Residual N Available in Soil (lb/A) |
|---|---|
| Soybean | 15—30 |
| Peanuts | 20—40 |
| Alfalfa | 80—100 |
| Hairy Vetch | 80—100 |
| Crimson Clover | 60—75 |
| Austrian Winter Pea | 50—60 |
Plant tissue analysis is another excellent tool that you can use to fine tune manure application rates. The NCDA&CS Agronomic Division also provides this service. More information on collecting good tissue samples can be found at the Animal Waste Management website.
Timing and Uniformity of Manure Applications
Manure must be applied within 30 days of planting, 30 days of breaking dormancy or to an actively growing crop. To minimize nitrogen losses, apply manure as close as possible to planting time or to the stage of crop development requiring maximum nitrogen uptake. Good timing increases the amount of nitrogen used by the crop and thus reduces the amount of nitrate that may leach into groundwater. Contamination of surface water and groundwater is greater when manure is applied in the fall or early winter for spring crops in the absence of a cover crop.
Whether dairy manure is applied with a manure spreader or by irrigation, it is important that it be applied uniformly. Non-uniform application leads to nutrient excesses and deficiencies, reduced yields, and uneven crop growth.
Calibrating Manure Application Equipment
Spreaders can apply manure at varying rates and patterns, depending on forward travel speed, power takeoff (PTO) speed, gearbox settings, gate openings, spread widths, and overlaps. Spreader calibration determines the combination of settings and travel speed needed to apply manure at the desired rate and uniformity.
Spreader Capacity
The capacity of liquid spreaders is normally rated by the manufacturer in gallons. Multiply the capacity in gallons by 0.0042 to find the capacity in tons. Solid and semisolid spreaders are rated by the manufacturer either in bushels or cubic feet. (Multiply bushels by 1.25 to convert to cubic feet.) Most spreaders have two rating capacities: (1) struck, or level full, and (2) heaped. Because manures and litters have different densities, perform an on-farm test. Fill a 5-gallon bucket level full with material to be spread. Ensure that the material settles in the bucket as it would in a loaded spreader. Weigh the bucket full and then empty. Multiply the weight of the contents by 1.5 to find the weight in pounds per cubic feet. Multiply this value by the spreader capacity in cubic feet then divide the result by 2,000 to find the weight of the spreader load in tons.
Calibration Method 1 (Load-Area Method)
This method is most useful for liquid spreaders but can be used for all types. Spread at least one full load of manure, preferably in a square or rectangular field pattern for ease of measuring, with normal overlaps. Measure the length and width of the area covered, recognizing that the outer fringe areas of the coverage will receive much lighter applications than the overlapped areas. Multiply the length by the width and divide by 43,560 to determine the coverage area in acres. Divide the number of tons of manure in the spreader by the acres covered to determine the application rate in tons per acre. (Refer to the box on the right.) Repeat the procedure at different speeds and spreader settings until the desired application rate is achieved.
Calibration Method 2 (Weight-Area Method)
This method is often used for solid and semisolid spreaders. Use a tarp or plastic sheet of about 100 square feet (approximately 9 feet by 12 feet or 10 feet by 10 feet). To determine its exact surface area, multiply the tarp's length by its width. After measuring, weigh the tarp using a set of spring-tension or platform scales, and then spread and pin it on the field surface. Operate the spreader at its normal settings, speed, and overlap. With a rear discharge spreader, make three passes: the first directly over the center of the sheet and the other two on opposite sides of the center at the normal spreader overlap spacing.
Carefully fold the sheet to avoid spilling any of the collected manure, and reweigh it to capture the total weight of the sheet and manure. Subtract the weight of the empty sheet from the total weight to find the weight of the collected manure. Multiply the weight of the collected manure in pounds by 21.8 and divide the result by the collection area of the sheet in square feet to find the application rate in tons per acre.
Repeat the procedure using different settings or speeds to obtain the desired application rate.
Spreader Pattern Uniformity
To determine the uniformity of spread and the amount of overlap needed, evenly place (2 to 4 feet apart) a line of small pans or trays across the spreader path. The pans should be a minimum of 12 inches by 12 inches or 15 inches in diameter, no more than 24 inches square, and 2 inches to 4 inches deep. Make one spreading pass directly over the center pan. Weigh the contents caught in each pan or pour the contents into equal-sized glass cylinders or clear plastic tubes and compare the amount in each.
Find the effective spread width by locating the point on either side of the path center where the manure contents caught in the containers is half of the amount collected in the center. The distance between these points is the effective spread width. Overlap the outer fringes of the coverage area beyond these points on the next path to ensure a uniform application rate over the entire field. Flat-top, pyramid, or oval patterns are most desirable and give the most uniform rate of application. Adjust the spreader to avoid unsatisfactory spread patterns such as: M, W, steeple, or lopsided.
Acreage Requirements for New or Expanding Facilities
When planning a new or expanded dairy operation, producers need to determine if there is adequate land to properly apply the manure. If an existing operation is expanding, it would be useful to use the average manure nutrient analysis from the farm if records have been maintained. When using farm waste analysis records, multiply average available nutrient values by manure production numbers found at the Nutrient Management Website. Make sure to account for all calves, heifers, and milk cows on the facility. When records do not exist, state average nutrient content on the Manure Nutrients section of the Nutrient Management Website can be used along with availability coefficients based on planned application method, located on the Plant-Availability Coefficients section. Then, use the Realistic Yields System and soil type to determine the number of acres needed for land application.
Value of Manure
To compare the economic worth of manure to that of commercial fertilizers, use the available nutrients listed on your waste analysis report. For example, the waste analysis in Figure 1 lists 4.15 pounds of plant-available nitrogen, 1.87 pounds of plant-available phosphate, and 12.8 pounds of plant-available potash per 1000 gallons of manure. At a value of 52 cents, 59 cents, and 41 cents per pound for commercial nitrogen, phosphate and potash, respectively, 1000 gallons of dairy lagoon liquid would be worth $7.53: (4.15 pounds × 50 cents) + (1.87 pounds × 59 cents) + (12.8 pounds × 34 cents) = $7.53.
This sum does not include the value of the secondary or micronutrients that are present in manures, nor does it include the cost of labor, transportation, or spreading costs to apply the manure. In addition, it assumes that a soil test calls for applications of phosphorus and potassium, when in fact many soils may already have adequate supplies. You can omit extraneous nutrients in assessing the financial value of the manure.
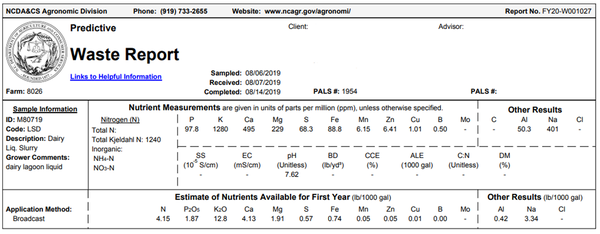
Figure 1. Example analysis of dairy lagoon liquid from NCDA&CS.
Land Application Example
Bill Jones is a dairy producer in Yadkin County using a manure basin to store his manure before applying it to land. He plans to plant com for silage in a field that has a Clifford fine sandy loam with 6% slope, and he anticipates a yield of about 21.9 tons of silage per acre based on the Realistic Yields Expectation Tool. According to the tool, he needs 238 pounds of plant-available nitrogen per acre. He does not plan to use any preplant or starter fertilizer and did not grow a legume crop last season. He plans to surface apply the slurry. Using the example waste analysis in Figure 1, we know the following nutrients are available in pounds per 1000 gal: N = 4.15; P2O5 = 1.87; K2O = 12.8. How much liquid manure slurry will he need to apply per acre to meet the nitrogen needs of his silage crop? Will he need to supplement his slurry application with commercial fertilizers to meet his soil test recommendations of 50 pounds of phosphate and 80 pounds of potash per acre, or will he have a surplus of these nutrients? The answers to these questions are given in the worksheet that follows. Use the same worksheet to determine the manure rates to apply on your farm.
Determine Nutrients Needs of Crop
| Step | Variables | Example | Your Farm |
|---|---|---|---|
|
Corn (silage) | ||
|
|
238 | |
|
50 |
|
|
|
80 |
|
|
|
|
0 |
|
|
0 |
|
|
|
0 |
|
|
|
0 |
|
|
|
|
238 |
|
|
50 |
|
|
|
80 |
|
|
Determine Rate of Manure to Apply
| Step | Variables | Example | Your Farm |
|---|---|---|---|
|
|
|
|
|
4.15 |
|
|
|
1.87 |
|
|
|
12.8 |
|
|
|
|
Nitrogen |
|
|
238 |
|
|
|
57.35 1000- Or 57,350 |
|
|
|
|
238 |
|
|
107 |
|
|
|
734 |
|
|
|
|
0 |
|
|
+57 |
|
|
|
+654 |
|
Source: Calculation format modified from Pennsylvania Department of Environmental Protection, Field Application of Manure, October 1986.
As you can see, annual application on an N-basis will always over supply P and, in many cases, K. In this example, application of an N-based rate resulted in over application of P and K by 57 and 654 pounds per acre, respectively. The result is a $33.63 (57 pounds × 59 cents) and $268.14 (654 pounds × 41 cents) loss in value of the manure, as these nutrients were applied when not needed.
A Nutrient Management Sample Worksheet (PDF, 83.1 KB) is available to download.
Acknowledgments
This publication is a revision of an earlier version. The authors acknowledge J. P. Zublena, J. C. Barker, and D. P. Wesen for their earlier contributions. The authors wish to acknowledge the assistance and cooperation of the NCDA&CS Agronomic Division for the development of the database used in this publication.
Publication date: March 30, 2022
AG-439-28
N.C. Cooperative Extension prohibits discrimination and harassment regardless of age, color, disability, family and marital status, gender identity, national origin, political beliefs, race, religion, sex (including pregnancy), sexual orientation and veteran status.