
Background
The passage of the 2018 Farm Bill led to the legalization of hemp (Cannabis sativa) production as an agricultural commodity crop in the United States. Under the Farm Bill, hemp is defined as Cannabis sativa that produces less than 0.3% total tetrahydrocannabinol (THC). Though hemp production was common in the United States prior to the 1940’s, the prohibition of Cannabis production led to the loss of production knowledge. Consequently, we find ourselves with a “new” crop requiring the development of research-based production recommendations.
Nutrient management is one of the most important factors to ensure optimized production for any crop. Lacking clear fertility guidelines, a grower risks loss of production due to under-application of nutrients or, conversely, loss of revenue due to over-application and unnecessary expenditures on excess fertilizer. In addition, over-application of nutrients poses a significant risk to our groundwater and environment through leaching and volatilization. As such, we conducted the following research to establish nitrogen (N) and potassium (K2O) fertilizer recommendations for optimum yield and cannabidiol (CBD) production while also understanding nutrient rate effects on THC production.
Experimental Design
Field experiments were conducted during the 2019 and 2020 growing seasons. We conducted the N rate trials on a commercial farm in Bertie County (BC-19-N and BC-20) and at the Piedmont Research Station (PRS) in Rowan County in both years. N rate trials were also conducted at the Lower Coastal Plain Research Station (LCPRS) in Lenoir County and Sandhills Research Station (SRS) in Moore County in 2020 only (n=6 unique location × year environments). The K2O rate trials were conducted at PRS in 2019 and 2020, at an on-farm location in Bertie County (BC-19-K) in 2019, and at SRS and LCPRS in 2020 (n=5 unique location × year environments). Table 1 lists soil physical and chemical properties for each location.
We investigated N and K2O rates of 0, 50, 100, 150, and 200 lb/ac. Nitrogen was split-applied as 28% liquid urea-ammonium nitrate (UAN) using a CO2-pressureized backpack sprayer. In both trials, half of the target N rate was applied 10 days after transplant (DAT) and the remainder was applied 28 DAT. Potassium sulfate (K2SO4) was the source material used in the K2O rate trials and was applied 10 DAT in a single sidedress application. Application rates for macro-, secondary, and micro-nutrients not under evaluation were consistent among N and K2O treatments (Table 2) and were supplied 10 DAT.
Both trials were arranged in a randomized complete block design with four blocks. Fertilizer treatments were applied to plots consisting of four treatment rows measuring between 30 and 40 feet in length. Each row contained five plants (n=20 plants per plot) with in-row spacing between 4.5 and 6 feet depending on location (Table 1 and Figure 1). Asexually propagated cuttings of the CBD hemp cultivar BaOx were used both years at all locations. Transplant occurred between May 16 and July 1, depending on year and location (Table 1).
|
Environment |
Soil Series |
Soil Texture |
Cation Exchange Capacity |
Row Spacing (ft) |
Plant Spacing (ft) |
Transplant Date |
Initial Soil K2O Valueh (lb/ac) |
|
PRS-19a |
Lloyd |
Clay loam |
6.7 – 7.2 |
5 |
5 |
May 16 |
185 |
|
BC-19-N b |
Wickham |
Fine sandy loam |
3.4 |
4 |
5 |
June 26 |
|
|
BC-19-K c |
Wickham |
Fine sandy loam |
6 |
5 |
July 1 |
||
|
PRS-20d |
Lloyd |
Clay loam |
7.7 |
5 |
5 |
June 3 |
165 |
|
SRS-20e |
Ailey |
Loamy sand |
4.5 |
3.7 |
4.5 |
June 2 |
110 |
|
LCPRS-20f |
Norfolk |
Loamy sand |
3.7 |
3.7 |
6 |
June 4 |
127 |
|
BC-20g |
Wickham |
Fine sandy loam |
4.0 |
4 |
5.5 |
June 23 |
247 |
|
a PRS-19 Salisbury, North Carolina 2019 |
|||||||
|
Nutrient |
Nitrogen Trial (lb/ac) |
Potassium Trial |
|
N |
—a |
100 |
|
P2O5 |
50 |
50 |
|
K2O |
150 |
— |
|
S |
88 |
28 |
|
Mg |
22 |
21 |
|
B |
1 |
1 |
|
a “—“ indicates nutrient of interest in designated trial. |
||

Figure 1. Aerial view of Sandhills Research Station nitrogen and potassium rate trials in 2020. Boxes outline individual treatment plots with example nutrient rates of 0, 50, 100, 150, and 200 lb/ac for one of the blocks.
Data Collection
Plants were considered mature once approximately 50% of the floral glandular trichomes were amber in color, which occurred between mid-September and early October. Two 8-inch floral samples were harvested from six plants from the outer two rows per plot (n=12 samples per treatment plot). These fresh floral samples were submitted for cannabinoid analysis to determine total THC (Δ-9 THC + 0.877×THCA) and total CBD (CBD + 0.877×CBDA). Three plants were harvested from the middle two rows, dried in a forced-air tobacco bulk curing barn at 150°F, and the floral and leaf material (biomass) was stripped and weighed. Biomass weights were used to calculate total yield per acre.
We categorized locations into two groups based on soil physical properties and cation exchange capacity (CEC). Cation exchange capacity is used to quantify a soil’s capacity to exchange positive ions with the soil solution and can affect nutrient availability (Havlin et al., 2013). The PRS comprised its own region (clay) because it was the only location with a clay soil type and had a higher CEC (Table 1). The LCPRS, SRS, and BC were grouped together because of the sandy soil type at these locations and fields with lower CECs; these locations collectively are referred to as sand. For all analyses, region (sand versus clay) was treated as a fixed effect.
Results
Nitrogen Rate Trial
Biomass production showed a distinct linear-plateau response to N (Figure 2), which is common in nitrogen rate trials (Anderson & Nelson, 1975; Scharf et al., 2005). Yields were higher in clay versus sand regardless of N rate. Biomass in the clay region increased linearly at a rate of 9.2 lb/ac for every additional pound of nitrogen applied and plateaued at 125 lb N/ac. Yields in the sand region increased linearly at a rate of 8.8 lb/ac until plateauing at 171 lb N/ac. The biomass plateau was 3,605 and 2,993 lb/ac in clay and sand, respectively. The observed results are most likely due to the quick draining nature of the coarse, sandy soils found in the sand region. Nitrogen readily leaches in these soils, which is exacerbated by regular rain events experienced throughout the growing season. Consequently, a higher rate of N was required in this region to reach maximum biomass yields as compared to the clay region where nitrogen does not leach as easily. A good practice in all soil types is to split N applications. Split applications can help limit the amount of leached N and ensure a steady supply throughout the active growing season.
We observed no significant effect of region in either total CBD or total THC concentrations. Furthermore, there was no significant N fertilizer rate effect on either cannabinoid; total CBD averaged 11.39% and total THC averaged 0.49% across all N treatments (Figure 3).
Potassium Rate Trial
Biomass production in the potassium trial was not significantly different between the two regions nor was it affected by potassium rate and averaged 2,685 lb/ac (Figure 4). These results indicate that the legacy potassium found in the fields in which we conducted the trials (Table 1) adequately met the crop’s requirements. The lowest concentration of legacy potassium in our trials was 91 lb K2O/ac, which is equivalent to 109 lb K2O/ac; thus, we recommend that farmers add enough potassium to meet this baseline level.
Similar to the nitrogen rate trial results, region and potassium fertilizer rates did not affect total CBD or total THC (Figure 5). Total CBD and THC concentrations averaged 11.97% and 0.52% across all potassium fertilizer rates, respectively.
There is a growing body of evidence demonstrating that genetics — not environmental stress — tightly regulate cannabinoid concentrations (Campell et al., 2019; Toth et al., 2021). Our results agree with these prior findings and demonstrate that neither N nor potassium fertilizer rates affect total CBD or THC concentrations (Figure 3 and Figure 5). Other than genetics, it is understood that cannabinoid concentrations increase the longer the hemp flower is allowed to mature. At the time of conducting these trials, there was little information on an optimum harvest window to remain below the 0.3% total THC compliance threshold. Basing floral maturity on trichome coloration is challenging and subjective. In our case, waiting until approximately 50% amber trichome coloration led to higher total THC concentrations of about 0.5% (Figure 3 and Figure 5), which is considered noncompliant. To ensure a compliant crop, growers should regularly test their hemp to get a snapshot of total THC concentrations. When in doubt, harvest earlier rather than later to avoid having a “hot,” noncompliant crop — with THC levels exceeding the allowed threshold — that must be destroyed.
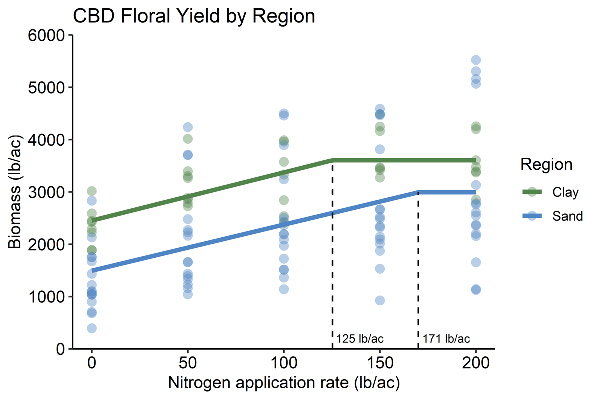
Figure 2. CBD hemp biomass yield response to increasing rates of nitrogen fertilizer application rates. Sand region represents trials in Bertie, Moore, and Lenoir Counties. Clay region represents trials conducted in Rowan County.
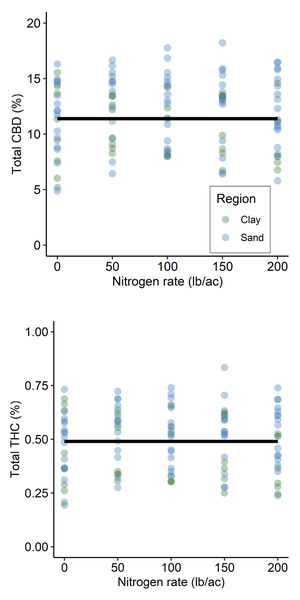
Figure 3. Effect of nitrogen fertilizer application rate on total CBD and total THC concentrations. Total CBD calculated as CBD + 0.877×CBDA and total THC calculated as Δ-9 THC + 0.877×THCA. Lines represent average cannabinoid concentration across nitroge
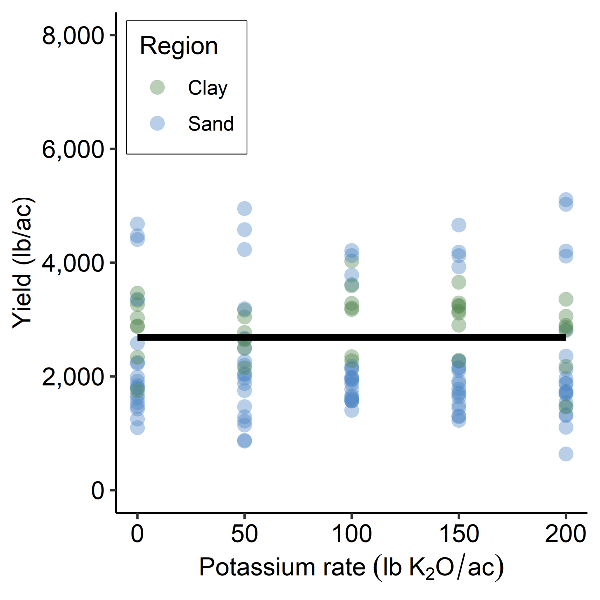
Figure 4. CBD hemp biomass yield response to increasing rates of potassium fertilizer. Sand region represents trials in Bertie, Moore, and Lenoir Counties. Clay region represents trials conducted in Rowan County.
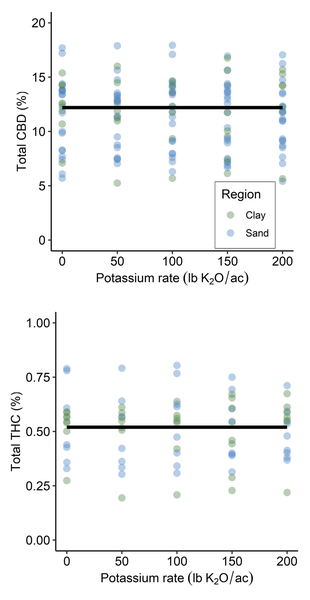
Figure 5. Effect of potassium fertilizer application rates on total CBD and THC. Total CBD calculated as CBD + 0.877×CBDA and total THC calculated as Δ-9 THC + 0.877×THCA. Lines represent average cannabinoid concentration across potassium treatments.
Key Takeaways
- Floral hemp biomass N requirements ranged between 125 and 170 lb N/ac depending on soil type.
- We recommend that growers split apply 150 lb N/ac during the vegetative stage of development. Growers using plastic mulch may be able to reduce this amount since leaching is better controlled.
- Potassium was not a limiting factor on biomass production.
- Farmers should test their soils and apply enough potassium to reach 110 lb K2O/ac.
References
Anderson, R.L. & L.A. Nelson. 1975. “A Family of Models Involving Intersecting Straight Lines and Concomitant Experimental Designs Useful in Evaluating Response to Fertilizer Nutrients.” Biometrics 31. 303-318.
Campbell B. J., A.F. Berrada, C. Hudalla, S. Amaducci, & J.K. McKay. 2019. “Genotype × Environment Interactions of Industrial Hemp Cultivars Highlight Diverse Responses to Environmental Factors.” Agrosystems, Geosciences, & Environment 2. 1-11.
Havlin, J. L. S. L. Tisdale, W. L. Nelson, & J. D. Beaton. 2013. Soil Fertility and Fertilizers: An Introduction to Nutrient Management, 8th ed. Pearson Education, Inc.
Scharf, P.C., N.R. Kitchen, K.A. Sudduth, J.G. Davis, V.C. Hubbard, & J.A. Lory. 2005. “Field-scale Variability in Optimal Nitrogen Fertilizer Rate for Corn.” Agronomy Journal 97. 452-461.
Toth, J.A., L.B. Smart, C.D. Smart, G.M. Stack, C.H. Carlson, G. Philippe, & J.K. Rose. 2021. “Limited Effect of Environmental Stress on Cannabinoid Profiles in High‐cannabidiol Hemp (Cannabis sativa L.).” GCB Bioenergy 13. 1666-1674.
Publication date: Dec. 8, 2021
AG-914
N.C. Cooperative Extension prohibits discrimination and harassment regardless of age, color, disability, family and marital status, gender identity, national origin, political beliefs, race, religion, sex (including pregnancy), sexual orientation and veteran status.