
The ultimate measure of the quality of a forage is animal performance (for example, milk production, weight gain, reproductive efficiency). Animal performance is a function of forage nutritive value (that is, the results from laboratory analysis of forage tissue samples) and forage intake (what animals eat), Figure 1. See also AG-792, Forage Quality: Concepts and Practices. The relative feed value (RFV) and relative forage quality (RFQ) indices (Rohweder et al., 1978; Moore and Undersander, 2002) were developed to estimate forage quality. The higher the index value, the greater the quality of the forage and consequently the greater the animal’s performance.
The purpose of this publication is twofold—first, to provide an overview of the differences in forage quality by reviewing a summary of 810 forage hay samples submitted to the N.C. State Fair Forage Contest from 1996 to 2015. The second purpose is to discuss the application of RFV and RFQ as a tool for ranking the quality of forages.
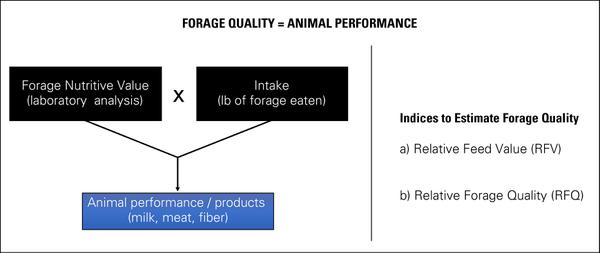
Figure 1. Factors that affect animal performance and indices for estimating forage quality.
Species Differ in Nutritive Value
In general, legumes tend to have the greatest digestibility, and tropical perennial grasses tend to have the lowest, Figure 2. The values of crude protein and digestibility are two of the measurements of nutritive value reported in the results of forage tissue testing.
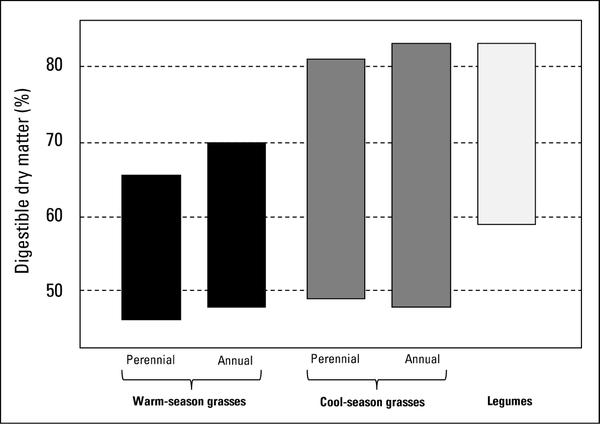
Figure 2. Digestibility ranges of major forage types. Adapted from Ball et al. 2001. Note that while the overall trend increases, ranges are wide and overlap among categories.
Integrating Nutritive Value and Animal Intake Estimates to Develop the Indices
A repeated challenge when evaluating forages is reconciling the varying levels of crude protein (CP) and energy reported in forage tissue laboratory analysis results. On average, the CP concentration of our forage species ranged between 10 and 15 percent CP, and the total digestible nutrients (TDN) values ranged between 60 and 65 percent, Figure 3. Crude protein is certainly a key nutrient in diets; nevertheless, energy is usually the most limiting factor when balancing diets for animals and is the first factor commonly used by nutritionists to balance animal rations.
The indices provide a single number that can be used to differentiate the quality of forages. The higher the number, the greater the forage quality. The number is achieved by integrating estimates of two components: 1) forage nutritive value, and 2) voluntary animal intake. The primary difference between RFV and RFQ lies in the methodology used to estimate the components.
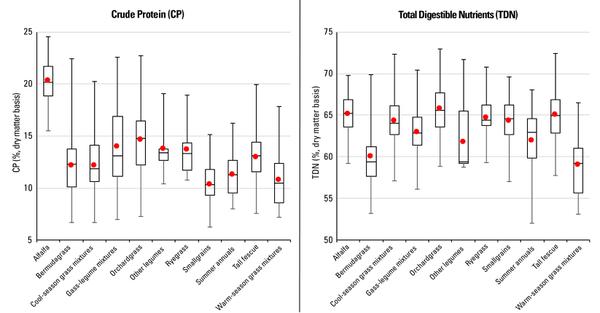
Figure 3. TDN is based on acid detergent fiber equations used by the laboratory. Samples submitted to the N.C. State Fair Forage Contest from 1996 to 2015. Red dots represent average concentrations; error bars represent the maximum and minimum values.
RFQ Is an Improved Index Compared to RFV
The RFQ index takes into account the digestibility of the fiber components (neutral detergent fiber or NDF) to estimate dry matter intake and energy (TDN). Thus, while two forages may have the same NDF concentration, the digestibility of the NDF component may vary, and therefore animal response would vary as well. On the other hand, RFV is limited to using the fiber concentration values for NDF (to estimate intake) and acid detergent fiber (ADF) to estimate energy. It does not take into account the difference in the digestibility of the fiber (neutral detergent fiber digestibility or NDFD). Estimates of intake and energy based solely on concentration values of NDF and ADF can be very variable and are poorly correlated (Moore and Undersander, 2002). A one-unit increase in in vitro NDF (NDFD) digestibility was associated with a 0.37 pound per day increase in dry matter intake and a 0.55 pound per day increase in 4 percent fat-corrected milk (Oba and Allen, 1999).
The indices are calculated as follows:
| Relative Forage Quality (RFQ) | Relative Feed Value (RFV) |
|---|---|
| \(RFQ=(DMI\times\ TDN)\div1.23\) | \(RFV=(DMI\times\ DDM)\div1.29\) |
| DMI = dry matter intake TDN = total digestible nutrients Both estimates (DMI, TDN) incorporate the digestibility of NDF in their calculations. |
DMI = dry matter intake (based on NDF concentration) |
For complete details of how to interpret the results of forage analysis reports, and how to calculate the indices, please see Extension publication AG-792, Forage Quality: Concepts and Practices.
Interpretation and Use of the RFV and RFQ Indices
The indices are unit-less, and in both systems a value of 100 represents roughly a full-bloom alfalfa (32 percent ADF, 53 percent NDF). The higher the number, the greater the quality of the forage. Estimates of forage quality from both indices are closely related (R2 = 0.86; Undersander and Moore, 2002); nevertheless, when RFQ and RFV are different, RFQ is a better index to use. If RFQ is higher than RFV, the seller could have gotten more for the hay (or the buyer got a good deal). If RFQ is lower than RFV, the animal performance would be lower than expected on a ration balanced on ADF. The indices provide a quick method for ranking the quality of forages and could be used as a marketing tool. Currently, the RFQ index is the tool used for judging forage quality in the Southeast Hay Contest.
The indices are useful for matching the appropriate forage (or forage lot) that most likely meets the nutritional demands of a given type of livestock, Figure 4. There is no reason to feed premium hay to a type of livestock that does not need it. The indices should not be used to balance diets. Once the right RFQ range and type of livestock are matched, the final valuation can be performed based on the cost ($) or value (contribution of specific nutritive value metrics) in the ration.
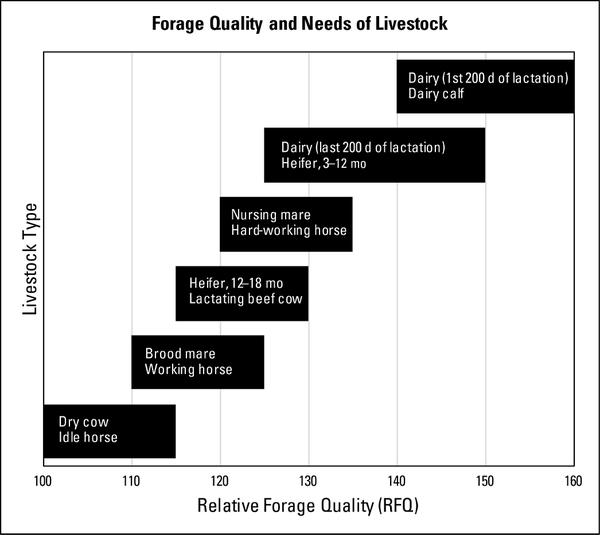
Figure 4. Relative forage quality ranges suitable for several types of livestock (adapted from Ball et al. 2008).
Summary and Conclusions
Forage quality indices that appear in forage analysis reports are a tool for ranking the quality of forages and for matching forage quality with the nutritional demands of a specific type of livestock. The indices do not replace the actual nutritive value metrics such as crude protein and energy that are used when balancing rations. The indices integrate nutritive value metrics and animal intake predictions in a single value. The greater the value, the more likely it is that the forage will meet the nutrient demands of a specific type of livestock.
Acknowledgments
Betsy Randall-Schadel coordinates the N.C. State Fair Hay Forage Contest and provided the data used to generate Figure 3.
References
References
Ball, D.M., M. Collins, G. D. Lacefield, N. P. Martin, D. A. Mertens, K. E. Olson, D. H. Putnam, D. J. Undersander, and M. W. Wolf. 2001. Understanding Forage Quality. American Farm Bureau Federation Publication 1-01, Park Ridge, IL.
Ball, D. M., E. Ballard, M. Kennedy, G. Lacefield, and D. Undersander. 2008. Extending Grazing and Reducing Stored Feed Needs. Grazing Lands Conservation Initiatitve. Publication 8-01, Bryan, TX.
Moore, J. E. and D. J. Undersander. 2002. “A Proposal for Replacing Relative Feed Value with an Alternative: Forage Relative Quality.” In Proc. Am. Forage and Grassl. Counc., Bloomington, MN, 14–17 July 2002 (pp. 171–175). Am. Forage and Grassl. Counc., Georgetown, TX.
Oba, M., and M. S. Allen. 1999. “Evaluation of the Importance of the Digestibility of Neutral Detergent Fiber from Forage: Effects on Dry Matter Intake and Milk Yield of Dairy Cows.” J. Dairy Sci. 82:589–596.
Rohweder, D. A., R. F. Barnes, and N. Jorgensen. 1978. “Proposed Hay Grading Standards Based on Laboratory Analyses for Evaluating Quality.” J. Anim. Sci. 47:747–759.
Undersander, D. J., and J. E. Moore. 2002. “Relative Forage Quality.” Focus on Forage. Vol. 4: No. 5. University of Wisconsin Extension Service.
Publication date: Sept. 16, 2016
AG-824
N.C. Cooperative Extension prohibits discrimination and harassment regardless of age, color, disability, family and marital status, gender identity, national origin, political beliefs, race, religion, sex (including pregnancy), sexual orientation and veteran status.