
Abstract
The predominant method for strawberry production in North Carolina and throughout the United States is annual hill plasticulture. However, growers continuously face challenges such as escalating labor and production costs, heavy pest and disease pressure, and recurrent yield losses due to extreme weather events and climate change. Transitioning to a soilless greenhouse production system (e.g. table-tops) could be an avenue to alleviate some of these challenges. However, greenhouse strawberry production in North Carolina faces a host of other challenges, one of which is the lack of knowledge on cultivar performance. To help growers better understand cultivar behavior in greenhouse conditions in NC, this study aimed to evaluate the performance of seven commonly grown cultivars (‘Albion’, ‘Brilliance’, ‘Camino Real’, ‘Fronteras’, ‘Monterey’, ‘Sensation’, ‘Sweet Charlie’) in a commercial strawberry greenhouse setting in Eastern North Carolina. The greenhouse was a multi-bay, mid tech, double poly plastic covered facility. The trial, which was planted in September 2022 and concluded in May 2023, was conducted on-farm using a randomized complete block design with four replicates per treatment. Although overall yield comparisons did not reveal any significant differences among cultivars for the season as a whole, there were notable differences during specific months of the harvest period which lasted from December through May. The two everbearing varieties in the trial, Albion and Monterey, were the earliest producers of fruit, while the standard short day varieties, Camino Real and Fronteras, had almost no early yields, but demonstrated substantial peak season production in April. Postharvest quality evaluation included pH, TA (total acidity) and Brix (soluble solids content). Although pH and TA were fairly similar over all cultivars, brix was more variable, with Sweet Charlie having the highest average brix and Brilliance having the lowest average brix.
Introduction
Strawberry production in Eastern North Carolina and across the United States relies on the use of the annual hill plasticulture system. Although this practice has proven to increase yields and profit in many areas of the country, North Carolina growers face an escalating number of challenges such as an increasing cost of labor and supplies and a short harvest period. Moreover, a changing climate in recent decades has led to significant pest and disease pressure, a surging number of extreme weather events, fluctuating temperatures, and heavy rain falls during the harvest season. All of these issues have led to more interest in alternative production methods, and one emerging alternative is greenhouse strawberry production.
Greenhouse strawberry production has to be seen as a long-term investment. In contrast to annual hill strawberry production, soilless greenhouse production requires a significant upfront cost for materials and structures. Growing strawberries in soilless substrates in a greenhouse also requires a different set of knowledge than open-field annual hill production. This is especially true for irrigation, fertilization, maintenance, pest management and cultivar choice. However, greenhouse strawberry production in NC has the potential to produce fruit 6-7 months out of a year, outperform field production, reduce labor cost, increase yields, avoid most weather events, and reduce pesticide use. Although greenhouse production may offer potential solutions for some growers, there is still a lot that needs to be learned for a successful transition from outdoor to indoor production. It is not recommended for anyone to rush into greenhouse production, but rather to contact NC State Extension and peers in the industry to better understand the risks associated with a venture into greenhouse strawberry production.
One of the core components of a transition to greenhouse strawberry production is to understand cultivar performance in a greenhouse setting. Therefore, we conducted this study to evaluate the performance of seven strawberry cultivars— ‘Albion’, ‘Brilliance’, ‘Camino Real’, ‘Fronteras’, ‘Monterey’, ‘Sensation’, and ‘Sweet Charlie’— within a commercial strawberry greenhouse. By assessing the plants for several growth characteristics, as well as evaluating yield and postharvest quality metrics over the entire greenhouse season, this research seeks to provide insight on the performance of these cultivars in Eastern North Carolina greenhouses.
Materials and Methods
Location, Trial Design, and Planting Material
The trial was conducted in a commercial strawberry greenhouse in Wilson, NC (Figure 1). The greenhouse was a double-polyethylene covered house with roll-up sides for cooling and ventilation. There were also fans available to facilitate cooling, and heaters for use during extremely cold periods. The greenhouse did not feature any supplemental lighting, but did include lights suitable for night-interruption lighting. The trial was established in a complete randomized block design. Four rows of the greenhouse were used, with each row representing a block, and each block contained all seven cultivars.
The strawberry cultivars used in this trial were ‘Albion’, ‘Brilliance’, ‘Camino Real’, ‘Fronteras’, ‘Monterey’, ‘Sensation’, and ‘Sweet Charlie’. The plants were received as unrooted daughter plants from Balamore Farm Ltd in Nova Scotia, Canada and were propagated in 50 cell trays containing Berger BM6 media, and they were rooted outdoors. After 23 days of establishment in the trays, the plug plants were standardized prior to planting. Only plants with fully established root balls, three to five leaves, and crown diameters between 6 and 9 millimeters for Fronteras, 8 and 11 millimeters for Monterey, and 7 and 10 millimeters for all other cultivars were used for this experiment. After this standardization, the plugs were transplanted on September 28th, 2022, and planted directly into plastic grow bags (Botanicoir Strawberry Grow Bag Precision Plus Ultra ©). The bags were located in raised gutters (Haygrove Ltd) that were approximately three feet from the ground (Figure 2).
Environmental Conditions
A drip irrigation system was used throughout the trial to supply water and nutrients to the plants directly (Table 1). The pH and EC of the excess water was measured throughout the season to gauge necessary fertility adjustments, however, these measurements were not recorded since they represented the whole greenhouse, not the trial alone. Temperature conditions were recorded throughout the season using Elitech RC-5 USB Temperature Data Loggers that were protected from direct solar radiation by plastic shade covers. Ten temperature loggers were distributed throughout the trial area and maintained at canopy height. To track light intensity, two HOBO MX2202 Pendant sensors were used and also remained at canopy height.
Plant Growth and Development
Crown diameter was measured monthly using an electronic caliper (Jiavarry IP54 Water-proof Digital Caliper Measuring Tool). Initially, crown diameter was measured on the solitary primary crown. As plants developed multiple crowns, the total number of crowns was recorded and the diameter of the largest crown was measured. Leaf number and leaf length were also recorded approximately once per month for each plant. The total number of leaves was counted, and the longest leaf was measured from the base of the leaf at the crown to the tip of the central leaflet. These plant growth measurements were taken for the first five months of the trial (September - February). Runners were removed as needed and their count recorded. For the first month of the trial, any flowers produced were recorded and then removed to encourage foliar growth and plant establishment. At the end of the season, a sample of six plants was collected from each replicated cultivar for destructive data collection. The selected plants were snapped off at the base of the crowns, and the number of crowns and crown diameter of the largest crown was recorded.
Components of Yield
For yield assessments, both marketable and non-marketable fruit were harvested weekly for each replicated cultivar (Figure 3). The total mass of marketable yield and non-marketable yield was measured in grams using a portable scale (Adam Equipment Cruiser CCT 32), and the total number of fruit in each category was counted. Fruits were categorized as marketable or non-marketable depending on quality factors like size, shape, color, maturity, and disease presence. Non-marketable fruits included those under ten grams, misshapen, over or under ripe, or diseased. After harvesting, the fruit was transported back to North Carolina State University Main Campus for postharvest quality evaluations.
Primary Fruit Chemistry
For each replicated cultivar, 5-10 representative fruits were collected. After removing the calyxes, the fruit was crushed inside sealable plastic bags. The crushed fruit was then frozen at (-20°C) for eight days. Following the freezing period, the fruit was allowed to thaw at room temperature for several hours. Once sufficiently thawed, the fruit juice was filtered and collected in beakers. The pH of the juice was measured using a pH meter, and collected by submerging the pH probe in the filtered fruit juice. Brix (total soluble solids) and TA (total acidity) were measured using an Atago Pocket Brix-Acidity Meter. The brix was measured by placing a few drops of the filtered fruit juice on the Atago Meter, and the TA was measured by diluting one milliliter of the fruit juice in 50 milliliters of deionized (DI) water and then placing a few drops of the solution onto the Atago Meter.
Statistical Analysis
Data was subjected to one-way ANOVA tests followed by a post-hoc Tukey’s honestly significant difference (HSD) test using the statistical program ‘R’.
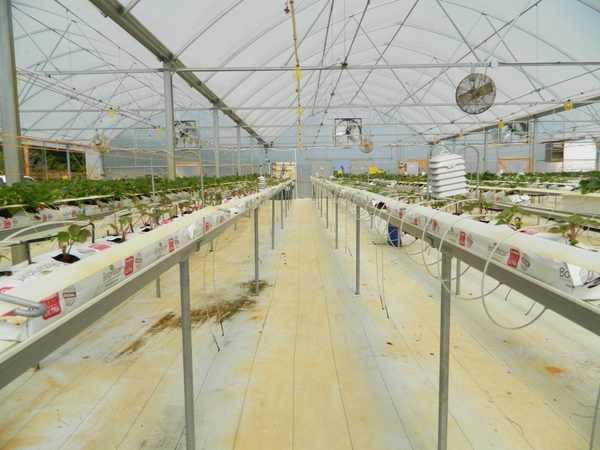
Figure 1. One bay in a multi-bay mid-tech plastic covered greenhouse with table-top strawberry production shortly after planting.
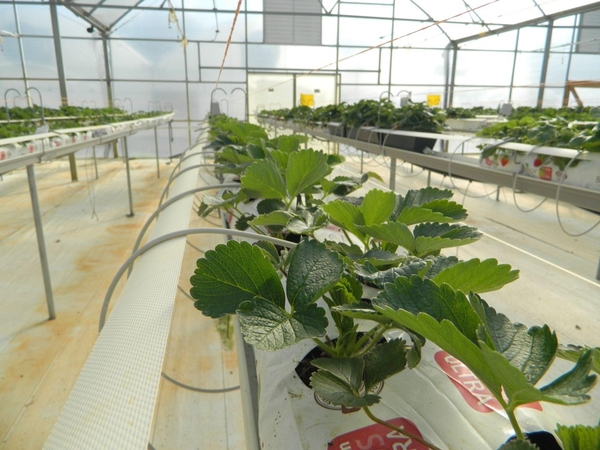
Figure 2. Closeup of strawberry planting in Botanicoir grow bags in the greenhouse.
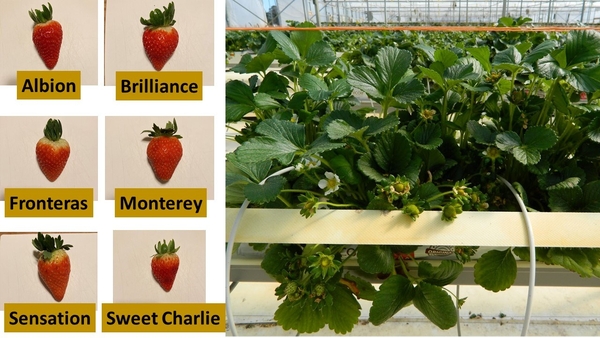
Figure 3. Examples of fruit of six cultivars (Albion, Brilliance, Fronteras, Monterey, Sensation & Sweet Charlie). Right: Albion in bloom in early spring.
Results
Environmental Conditions
Fertilizer
| NO3- | NH4+ | P | K | Mg | Ca | S | Fe | Mn | Zn | B | Cu | Mo | pH | EC | |
|---|---|---|---|---|---|---|---|---|---|---|---|---|---|---|---|
| Vegetativey | 148 | 9 | 41 | 150 | 36 | 147 | 40 | 2.0 | 1.0 | 0.5 | 0.15 | 0.1 | 0.05 | 5.5 | 1.4 |
| Fruitingx | 154 | 7 | 41 | 241 | 34 | 114 | 37 | 2.0 | 1.0 | 0.5 | 0.17 | 0.1 | 0.05 | 5.5 | 1.4 |
yThe vegetative recipe is used for ~1 month (Sept-October). ↲
xThe fruiting recipe is implemented in October when early harvests begin ↲
Light and Temperature
| Monthx | Light Quantity (µmol/m²/s)z | Temperaturew (℃) | |||||
|---|---|---|---|---|---|---|---|
| Day Lengthy | Nightbreakv | Max | Averageu | Min | Max | Average | |
| September | 12.36 | 0 | 377.84 | 84.88 | |||
| October | 12.25 | 0 | 440.69 | 129.52 | |||
| November | 3.40 | 34.7 | 13.63 | ||||
| December | 10.50 | 0 | 242.36 | 77.35 | -0.70 | 27.1 | 11.07 |
| January | 10.69 | 0 | 306.30 | 76.21 | 1.40 | 27.7 | 10.12 |
| February | 14.08 | 3 | 355.06 | 90.65 | 1.50 | 36.6 | 13.85 |
| March | 15.16 | 3 | 361.99 | 106.70 | 1.80 | 39.1 | 14.63 |
| April | 15.07 | 2.5 | 451.26 | 117.74 | 4.70 | 39.9 | 19.32 |
| May | 14.20 | 0 | 424.84 | 97.95 | 6.50 | 36.8 | 20.65 |
Z Light was measured in lux and then converted to µmol/m²/s ↲
Y Average day length is the average number of hours per day that had more than 0.05 µmol/m²/s of light ↲
X September light data only includes Sept. 28-30 since the trial began on Sept. 28. Due to ongoing data logger issues, the light data presented for October is based only on Oct. 1-10; no light data was collected for November, and light data for December is based on Dec. 20-31. January - April light data is complete and accurate. May light data only includes May 1-25 since the trial ended on May 25. ↲
W Due to data logger issues, no temperature data was collected for the month of September or October. Temperature data from November 1st, 2022 through January 13th, 2023 was provided from four sensors distributed throughout the whole greenhouse. Temperature data after January 13th is complete and accurate, based on ten temperature sensors distributed throughout the trial area. ↲
V Refers to the total number of hours of night interruption lighting that plants received. ↲
U The average light reflects only the average amount of light received during daylight hours. Hours of darkness and night interruption lighting were not included in this calculation. ↲
Temperatures for Wilson, NC during the production cycle from September 2022 to May 2023 were typical for the area; the temperatures shown in Table 2 are slightly higher than the average temperatures for the area due to the warm nature of the greenhouse environment. The coldest month of the trial on average was January 2023 at 10.12℃ (50.2℉), however, the lowest minimum temperature occurred in December 2022 at -0.70℃ (30.7℉). After January, temperatures steadily rose, with the average temperature peaking at the end of the trial in May at 20.65℃ (69.2℉), however, the highest maximum temperature was recorded in April at 39.9℃ (103.8℉). For light quantity, October had the highest average light quantity of 129.52 μmol/m²/s, and January had the lowest average light quantity of 76.21 μmol/m²/s; since the greenhouse did not feature supplemental lighting, the differences in light quantity are entirely due to the outdoor environmental conditions.
Plant Growth and Development
Crown Diameter and Number
| Cultivar | Crown Diameter (mm)y | Crown Numberx | EOS Crown Diameter (mm) | EOS Crown Number |
|---|---|---|---|---|
| Albion | 13.4 ± 2.7 abc | 1.7 ± 0.8 b | 19.6 a | 2.96 b |
| Brilliance | 13.0 ± 3.4 bc | 1.8 ± 1.0 ab | 19.6 a | 3.79 ab |
| Camino Real | 13.2 ± 3.5 bc | 1.7 ± 0.8 b | 20.5 a | 4.46 a |
| Fronteras | 12.7 ± 3.5 c | 1.8 ± 0.9 ab | 20.2 a | 4.50 a |
| Monterey | 14.2 ± 2.8 a | 1.9 ± 1.0 ab | 19.9 a | 4.29 a |
| Sensation | 12.9 ± 3.1 bc | 2.0 ± 1.1 a | 19.7 a | 3.92 a |
| Sweet Charlie | 13.6 ± 3.3 ab | 1.8 ± 0.9 ab | 18.5 b | 3.75 ab |
z Results of One-Way ANOVA (alpha-level = 0.05) followed by Post-Hoc Tukey’s Honestly Significant Difference (HSD) test (P < 0.05) for Multiple Comparisons ↲
y Average crown diameter ± standard error ↲
x Average total number of branch crowns ± standard error ↲
Leaf Number and Length
| Cultivar | Leaf Numbery | Leaf Lengthx (cm) |
|---|---|---|
| Albion | 9.0 ± 0.3 c | 11.9 ± 0.1 c |
| Brilliance | 11.4 ± 0.4 ab | 14.0 ± 0.1 b |
| Camino Real | 9.9 ±0.3 bc | 11.7 ± 0.1 c |
| Fronteras | 11.9 ± 0.4 a | 14.8 ± 0.1 a |
| Monterey | 11.9 ± 0.4 a | 14.5 ± 0.1 ab |
| Sensation | 12.3 ± 0.4 a | 14.6 ± 0.1 ab |
| Sweet Charlie | 11.0 ± 0.3 ab | 13.9 ± 0.1 b |
z Results of One-Way ANOVA (alpha-level = 0.05) followed by Post-Hoc Tukey’s Honestly Significant Difference (HSD) test (P < 0.05) for Multiple Comparisons ↲
y Average total number of leaves ± standard error ↲
x Average leaf length ± standard error ↲
For the first half of the season (September-January), ‘Monterey’ had a significantly larger crown diameter with an average of 14.2 mm, compared to ‘Fronteras’, ‘Brilliance’, ‘Camino Real’, and ‘Sensation’ (Table 3). However, ‘Sensation’ had significantly more crowns, compared to ‘Albion’ and ‘Camino Real’ (Table 3). Additionally, ‘Sensation’,’Monterey’ and ‘Fronteras’ had significantly more leaves per plant than ‘Albion’ (Table 4).‘Fronteras’ had the longest leaves, compared to ‘Albion’, ‘Camino Real’, ‘Brilliance’ and ‘Sweet Charlie’ (Table 4). Overall, ‘Fronteras’ seemed to have a high number of leaves and long leaves but smaller crowns compared to the other cultivars resulting in a “leggier” appearance than the other cultivars. On the other hand, ‘Albion’ and ‘Camino Real’ seemed to have moderate to small sized crowns and less crowns, and also had a low number of leaves and shorter leaf length compared to the other cultivars giving the plants a more compact architecture than the other cultivars.
Components of Yield
Marketable and Non-Marketable Yield
| Cultivar | Marketable (g/lm) y | Non-Marketable (g/lm) | Marketable (g/plant)x | Non-Marketable (g/plant) | Berry Size (g)w |
|---|---|---|---|---|---|
| Albion | 4573 ± 259 a | 584 ± 72 b | 571.7 ± 32.4 a | 73.0 ± 9.0 b | 18.4 ± 0.2 ab |
| Brilliance | 5107 ± 188 a | 971 ± 28 ab | 638.4 ± 23.5 a | 121.4 ± 3.5 ab | 17.5 ± 0.7 ab |
| Camino Real | 4733 ± 238 a | 802 ± 51 ab | 591.7 ± 29.7 a | 100.3 ± 6.4 ab | 16.9 ± 0.6 b |
| Fronteras | 5378 ± 609 a | 1094 ± 99 a | 672.3 ± 76.1 a | 136.8 ± 12.4 a | 18.6 ± 1.2 ab |
| Monterey | 5369 ± 193 a | 701 ± 76 ab | 671.1 ± 24.1 a | 87.6 ± 9.5 ab | 17.3 ± 0.2 ab |
| Sensation | 5609 ± 174 a | 1036 ± 74 a | 701.1 ± 21.7 a | 129.5 ± 9.3 a | 19.5 ± 0.4 a |
| Sweet Charlie | 4145 ± 133 a | 834 ± 82 ab | 518.1 ± 16.6 a | 104.2 ± 10.3 ab | 11.9 ± 0.3 c |
z Results of One-Way ANOVA (alpha-level = 0.05) followed by Post-Hoc Tukey’s Honestly Significant Difference (HSD) test (P < 0.05) for Multiple Comparisons ↲
y Whole season total yield in grams per linear meter ± standard error ↲
x Whole season total yield in grams per plant ± standard error ↲
wAverage of marketable berry size from 03/05/23 - 05/22/23 ± standard error ↲
‘Sensation’ was the highest yielding cultivar overall with an average marketable yield of 701 g/plant, and ‘Sweet Charlie’ was the lowest yielding cultivar with an average marketable yield of 518 g/plant (Table 5). The difference in overall yield between these two cultivars, and the remaining five cultivars, was not statistically significant. ‘Monterey’ and ‘Albion’ were the first two cultivars to produce fruit with early harvests beginning in December (Figure 4). In January, ‘Camino Real’ produced significantly less fruit than all other varieties (Figure 5). In February ‘Sensation’ and ‘Sweet Charlie’ had the highest yields at 173 g/plant and 185 g/plant respectively, and this was significantly higher than ‘Camino Real’ which yielded around 45 g/plant for the month (Figure 6). ‘Sensation’ and ‘Sweet Charlie’ remained the highest yielding cultivars in March with 204 g/plant and 232 g/plant, respectively; this was significantly higher than all other cultivars for March. In April, Camino Real was the highest yielding cultivar at 493 g/plant which was significantly higher than ‘Albion’ and ‘Sweet Charlie’ with 329 g/plant and 214 g/plant respectively. ‘Monterey’ was the highest yielding in May with 112 g/plant and was significantly higher than Brilliance at 43 g/plant. Everbearing varieties had the earliest yields, starting in December, while two short-day-Florida varieties became top producers in the following months. Peak yields for all varieties occurred in April, except for Sweet Charlie, which peaked in March. In May, all yields declined, with the short-day-Florida varieties being the most affected and the everbearing varieties the least impacted.
Primary Fruit Chemistry
| Cultivar | pH2 | TA3 | Brix | ||
|---|---|---|---|---|---|
| Average4 | Min | Max | |||
| Albion | 3.60 ± 0.02 b | 0.60 ± 0.02 a | 7.40 ± 0.18 ab | 2.9 | 10.3 |
| Brilliance | 3.68 ± 0.03 b | 0.51 ± 0.02 b | 6.13 ± 0.21 c | 3.7 | 9.3 |
| Camino Real | 3.58 ± 0.03 b | 0.49 ± 0.02 b | 6.75 ± 0.21 bc | 4.4 | 9.5 |
| Fronteras | 3.61 ± 0.03 b | 0.47 ± 0.02 b | 6.70 ± 0.21 bc | 4.4 | 9.0 |
| Monterey | 3.66 ± 0.03 b | 0.58 ± 0.02 a | 7.18 ± 0.19 b | 5.1 | 10.5 |
| Sensation | 3.63 ± 0.02 b | 0.50 ± 0.02 b | 7.02 ± 0.19 b | 5.3 | 10.7 |
| Sweet Charlie | 3.80 ± 0.03 a | 0.49 ± 0.01 b | 7.97 ± 0.17 a | 4.4 | 10.1 |
1 Results of One-Way ANOVA (alpha-level = 0.05) followed by Post-Hoc Tukey’s Honestly Significant Difference (HSD) test (P < 0.05) for Multiple Comparisons ↲
2 Average pH for the whole tested period (2/22/23-5/30/23) ± standard error ↲
3 Average TA (total acidity) for the whole tested period (2/22/23-5/30/23) ± standard error ↲
4 Average Brix (total soluble solids) for the whole tested period (2/22/23-5/30/23) ± standard error ↲
For the season as a whole, there were not a lot of differences in the postharvest traits of pH and TA. However, ‘Sweet Charlie’, ‘Albion’, ‘Monterey’ and ‘Sensation’ had significantly higher brix than ‘Brilliance’, and ‘Sweet Charlie’ had significantly higher brix than all other cultivars with the exception of ‘Albion’ (Table 6). Although Albion had the second highest average brix level, it also had the lowest minimum brix recorded, indicating high variability over the season.
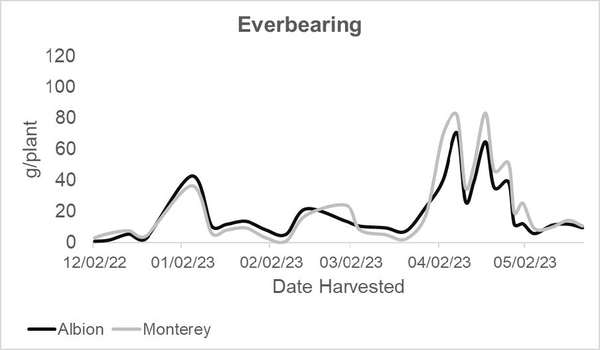
Figure 4. Average yield per plant over the entire harvest season (12/02/22 - 05/22/23). The graph shows the two everbearing cultivars in the trial.
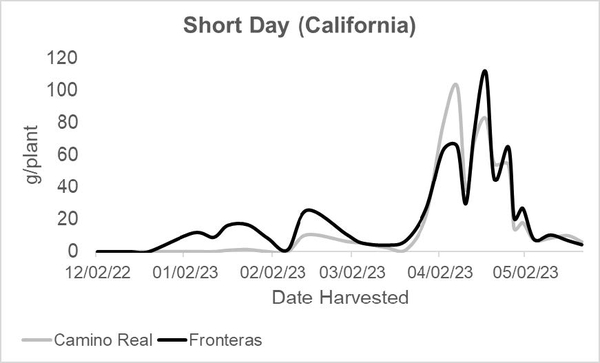
Figure 5. Average yield per plant over the entire harvest season (12/02/22 - 05/22/23). The graph shows two short day cultivars.
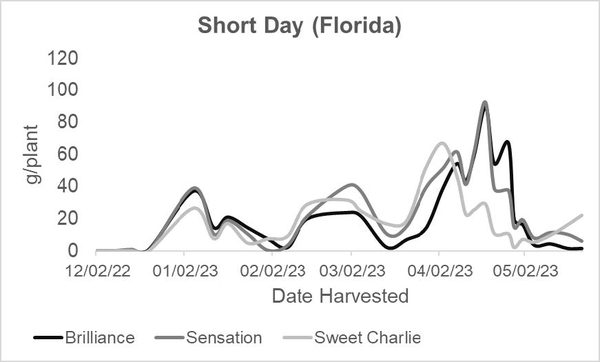
Figure 6. Average yield per plant over the entire harvest season (12/02/22 - 05/22/23). The graph shows three short day and low-chill varieties.
Conclusions
This study sought to contribute valuable insights into Eastern North Carolina strawberry greenhouse production by evaluating the performance of seven strawberry cultivars in a commercial greenhouse setting. Overall, yield was not found to be significantly different for any of the cultivars when looking at the season as a whole. However, there were differences found from month-to-month throughout the harvest season. For example, ‘Albion’ and ‘Monterey’, the everbearing cultivars, had the earliest production and produced fruit throughout the whole season, whereas other cultivars like ‘Camino Real’ produced nearly all of its fruit within the month of April, when production peaked for most cultivars. Early and late-season peaks in certain varieties emphasize the importance of strategic cultivation planning for optimal strawberry production.
It is important to note that these are the results of one season (2022/23). There were two cultivars that stood out as having both significant yields and acceptable fruit quality– Monterey and Sensation were two of the highest yielding cultivars for the season as a whole, and both had an average brix over 7.0. This trial is currently being repeated to advance knowledge for NC greenhouse producers. As the trend towards greenhouse production continues to grow, persistent research and collaborative efforts will be instrumental in refining cultivation practices and addressing the various challenges faced by strawberry growers. The findings presented here serve as a foundation for further exploration and optimization of greenhouse strawberry cultivation within North Carolina.
Publication date: Jan. 15, 2024
Reviewed/Revised: Jan. 11, 2024
N.C. Cooperative Extension prohibits discrimination and harassment regardless of age, color, disability, family and marital status, gender identity, national origin, political beliefs, race, religion, sex (including pregnancy), sexual orientation and veteran status.