
Introduction
Loggers, timber buyers, and others have good reasons to be interested in historic North Carolina delivered timber prices, prices paid upon delivery of the timber to the mill. Not only is such information useful in assessing current market opportunities, but may also be useful in analyzing business trends. Delivered prices provides insight into the compensation loggers may receive for all their costs, plus a minor profit for their labors. Delivered prices consist of the price paid to landowners for their standing timber + cutting + skidding + loading + hauling + other fixed costs + variable costs.
These historic price data have been compiled from various sources (primarily Timber Mart-South since 1988). Annual market prices are averages of delivered prices reported at the time. Considerable additional information on these products and others, as well as other states and regions, are available from the collectors and distributors of price information.
Delivered price data are reported for four timber product categories (pine sawtimber and pulpwood, and mixed hardwood sawtimber and pulpwood) for western North Carolina, eastern North Carolina, statewide, and southeast, United States. Eastern North Carolina is defined as the region east of, and including, Granville, Wake, Lee, Moore, Richmond and Anson counties (Figure 1). Western North Carolina is defined as the region west of and including Person, Durham, Chatham, Montgomery, Stanley, and Union counties (Figure 1).
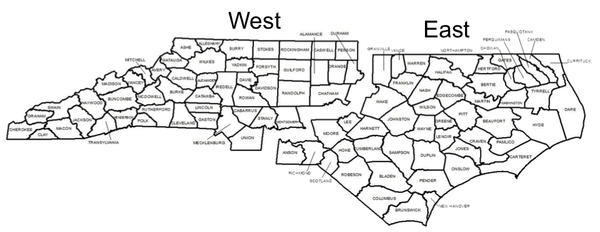
Figure 1: Map of North Carolina counties divided into two regions, east and west.
Created by Jessica Knight
Pine Sawtimber Delivered Price History ($/1000 board feet, Scribner log rule)
|
Year |
Eastern NC |
Western NC |
State-wide Average |
Southeast-wide Average |
|
1988 |
$206.00 |
$164.00 |
$188.00 |
|
|
1989 |
$224.00 |
$162.00 |
$194.00 |
|
|
1990 |
$240.00 |
$160.00 |
$199.00 |
|
|
1991 |
$230.00 |
$166.00 |
$192.00 |
|
|
1992 |
$232.00 |
$173.00 |
$203.00 |
$222.00 |
|
1993 |
$264.00 |
$187.00 |
$226.00 |
$256.00 |
|
1994 |
$287.00 |
$231.00 |
$259.00 |
$316.00 |
|
1995 |
$295.00 |
$233.00 |
$264.00 |
$349.00 |
|
1996 |
$355.00 |
$200.00 |
$277.00 |
$329.00 |
|
1997 |
$404.00 |
$205.00 |
$304.00 |
$379.00 |
|
1998 |
$423.00 |
$235.00 |
$329.00 |
$402.00 |
|
1999 |
$384.00 |
$243.00 |
$314.00 |
$373.00 |
|
2000 |
$429.00 |
$282.00 |
$356.00 |
$388.00 |
|
2001 |
$390.00 |
$269.00 |
$330.00 |
$354.00 |
|
2002 |
$400.00 |
$294.00 |
$347.00 |
$361.00 |
|
2003 |
$397.00 |
$346.00 |
$371.00 |
$366.00 |
|
2004 |
$371.00 |
$277.00 |
$324.00 |
$381.00 |
|
2005 |
$435.00 |
$312.00 |
$374.00 |
$406.00 |
|
2006 |
$406.00 |
$315.00 |
$360.00 |
$395.00 |
|
2007 |
$399.00 |
$307.00 |
$353.00 |
$380.00 |
|
2008 |
$369.00 |
$318.00 |
$343.00 |
$360.00 |
|
2009 |
$341.00 |
$288.00 |
$314.00 |
$318.00 |
|
2010 |
$371.00 |
$305.00 |
$338.00 |
$333.00 |
|
2011 |
$338.00 |
$275.00 |
$306.00 |
$311.00 |
|
2012 |
$319.00 |
$302.00 |
$310.00 |
$310.00 |
|
2013 |
$347.00 |
$319.00 |
$333.00 |
$323.00 |
|
2014 |
$346.00 |
$310.00 |
$328.00 |
$334.00 |
|
2015 |
$338.00 |
$293.00 |
$315.00 |
$335.00 |
|
2016 |
$361.00 |
$292.75 |
$327.25 |
$328.75 |
|
2017 |
$342.50 |
$287.50 |
$315.00 |
$320.75 |
|
2018 |
$342.65 |
$290.28 |
$316.54 |
$319.25 |
|
2019 |
$385.75 |
$284.25 |
$353.23 |
$328.50 |
|
2020 |
$370.50 |
$259.50 |
$315.25 |
$305.75 |
|
2021 |
$423.46 |
$330.98 |
$377.44 |
$338.87 |
|
2022 |
$390.05 |
$316.75 |
$353.40 |
$339.00 |
|
2023 |
$381.75 |
$361.00 |
$371.75 |
$332.00 |
|
2024 |
$397.49 |
$344.13 |
$370.35 |
$324.68 |
Pine Pulpwood Delivered Price History ($/Cord, Scribner log rule)
|
Year |
Eastern NC |
Western NC |
State-wide Average |
Southeast-wide Average |
|
1988 |
$42.18 |
$42.31 |
$42.68 |
|
|
1989 |
$44.00 |
$46.00 |
$45.46 |
|
|
1990 |
$46.39 |
$49.14 |
$48.55 |
|
|
1991 |
$48.50 |
$49.18 |
$49.06 |
|
|
1992 |
$48.58 |
$45.26 |
$46.92 |
$51.89 |
|
1993 |
$38.60 |
$53.30 |
$45.95 |
$56.65 |
|
1994 |
$54.03 |
$50.37 |
$52.20 |
$56.53 |
|
1995 |
$61.00 |
$51.00 |
$56.00 |
$61.70 |
|
1996 |
$49.78 |
$48.14 |
$48.96 |
$59.88 |
|
1997 |
$54.63 |
$49.17 |
$51.90 |
$65.62 |
|
1998 |
$58.39 |
$48.85 |
$53.62 |
$67.32 |
|
1999 |
$48.33 |
$48.37 |
$48.35 |
$61.38 |
|
2000 |
$56.14 |
$49.47 |
$52.81 |
$58.22 |
|
2001 |
$56.34 |
$44.16 |
$50.25 |
$56.20 |
|
2002 |
$56.24 |
$46.55 |
$51.39 |
$56.96 |
|
2003 |
$54.52 |
$51.16 |
$52.84 |
$60.46 |
|
2004 |
$57.96 |
$49.89 |
$53.93 |
$60.31 |
|
2005 |
$57.57 |
$55.57 |
$56.57 |
$66.77 |
|
2006 |
$59.99 |
$56.83 |
$58.41 |
$64.16 |
|
2007 |
$61.43 |
$60.18 |
$60.81 |
$68.11 |
|
2008 |
$64.10 |
$62.94 |
$63.52 |
$73.27 |
|
2009 |
$68.89 |
$64.56 |
$66.72 |
$68.77 |
|
2010 |
$70.02 |
$63.97 |
$66.99 |
$73.63 |
|
2011 |
$68.27 |
$61.34 |
$64.81 |
$70.03 |
|
2012 |
$69.14 |
$64.59 |
$66.87 |
$73.07 |
|
2013 |
$72.39 |
$66.34 |
$69.36 |
$76.21 |
|
2014 |
$82.22 |
$67.86 |
$75.04 |
$80.12 |
|
2015 |
$75.84 |
$64.47 |
$70.15 |
$79.73 |
|
2016 |
$83.28 |
$68.53 |
$75.91 |
$79.91 |
|
2017 |
$92.71 |
$72.80 |
$82.75 |
$78.41 |
|
2018 |
$91.86 |
$72.46 |
$82.17 |
$82.23 |
|
2019 |
$86.46 |
$71.85 |
$79.20 |
$78.77 |
|
2020 |
$81.99 |
$67.72 |
$74.86 |
$75.50 |
|
2021 |
$90.94 |
$74.50 |
$82.73 |
$80.72 |
|
2022 |
$91.47 |
$82.99 |
$87.23 |
$87.09 |
|
2023 |
$82.44 |
$84.93 |
$83.69 |
$82.91 |
|
2024 |
$83.93 |
$77.51 |
$80.75 |
$81.69 |
Mixed Hardwood Sawtimber Delivered Price History ($/1000 board feet, Doyle log rule)
|
Year |
Eastern NC |
Western NC |
State-wide Average |
Southeast-wide Average |
|
1988 |
$148.00 |
$165.00 |
$160.00 |
|
|
1989 |
$157.00 |
$166.00 |
$162.00 |
|
|
1990 |
$181.00 |
$163.00 |
$173.00 |
|
|
1991 |
$188.00 |
$154.00 |
$173.00 |
|
|
1992 |
$211.00 |
$192.00 |
$201.00 |
$176.00 |
|
1993 |
$203.00 |
$205.00 |
$204.00 |
$226.00 |
|
1994 |
$246.00 |
$202.00 |
$224.00 |
$217.00 |
|
1995 |
$229.00 |
$211.00 |
$220.00 |
$243.00 |
|
1996 |
$265.00 |
$237.00 |
$251.00 |
$238.00 |
|
1997 |
$264.00 |
$261.00 |
$262.00 |
$262.00 |
|
1998 |
$245.00 |
$261.00 |
$253.00 |
$273.00 |
|
1999 |
$194.00 |
$259.00 |
$226.00 |
$257.00 |
|
2000 |
$251.00 |
$249.00 |
$249.00 |
$267.00 |
|
2001 |
$279.00 |
$250.00 |
$265.00 |
$282.00 |
|
2002 |
$286.00 |
$302.00 |
$294.00 |
$292.00 |
|
2003 |
$236.00 |
$279.00 |
$257.00 |
$316.00 |
|
2004 |
$253.00 |
$263.00 |
$258.00 |
$318.00 |
|
2005 |
$289.00 |
$303.00 |
$297.00 |
$332.00 |
|
2006 |
$288.00 |
$290.00 |
$289.00 |
$322.00 |
|
2007 |
$305.00 |
$294.00 |
$299.00 |
$332.00 |
|
2008 |
$302.00 |
$334.00 |
$318.00 |
$346.00 |
|
2009 |
$297.00 |
$290.00 |
$293.00 |
$336.00 |
|
2010 |
$336.00 |
$307.00 |
$322.00 |
$355.00 |
|
2011 |
$350.00 |
$316.00 |
$333.00 |
$355.00 |
|
2012 |
$359.00 |
$331.00 |
$345.00 |
$373.00 |
|
2013 |
$394.00 |
$364.00 |
$379.00 |
$400.00 |
|
2014 |
$431.00 |
$411.00 |
$421.00 |
$445.00 |
|
2015 |
$431.00 |
$356.00 |
$393.00 |
$458.00 |
|
2016 |
$414.75 |
$325.75 |
$370.25 |
$466.50 |
|
2017 |
$398.50 |
$364.00 |
$381.25 |
$455.00 |
|
2018 |
$393.95 |
$367.68 |
$382.89 |
$454.04 |
|
2019 |
$452.50 |
$428.50 |
$432.11 |
$468.33 |
|
2020 |
$433.00 |
$410.00 |
$421.75 |
$468.75 |
|
2021 |
$457.72 |
$421.40 |
$439.65 |
$463.68 |
|
2022 |
$574.50 |
$526.00 |
$550.25 |
$521.25 |
|
2023 |
$584.00 |
$581.75 |
$583.25 |
$525.75 |
|
2024 |
$578.31 |
$535.31 |
$557.03 |
$521.80 |
Hardwood Pulpwood Delivered Price History ($/Cord Doyle log rule)
|
Year |
Eastern NC |
Western NC |
State-wide Average |
Southeast-wide Average |
|
1988 |
$34.71 |
$37.15 |
$37.12 |
|
|
1989 |
$38.38 |
$44.00 |
$41.67 |
|
|
1990 |
$42.50 |
$47.05 |
$45.06 |
|
|
1991 |
$40.88 |
$46.43 |
$44.26 |
|
|
1992 |
$46.50 |
$44.07 |
$45.29 |
$43.92 |
|
1993 |
$49.49 |
$48.10 |
$48.79 |
$50.01 |
|
1994 |
$51.78 |
$51.60 |
$51.69 |
$50.33 |
|
1995 |
$55.00 |
$50.00 |
$52.50 |
$57.25 |
|
1996 |
$49.06 |
$52.96 |
$51.00 |
$54.50 |
|
1997 |
$54.90 |
$53.49 |
$54.19 |
$62.01 |
|
1998 |
$56.03 |
$52.73 |
$54.38 |
$60.54 |
|
1999 |
$49.19 |
$54.19 |
$51.69 |
$54.43 |
|
2000 |
$60.08 |
$55.94 |
$58.01 |
$54.88 |
|
2001 |
$57.90 |
$52.54 |
$55.21 |
$60.94 |
|
2002 |
$53.75 |
$53.70 |
$53.72 |
$61.21 |
|
2003 |
$54.56 |
$66.26 |
$60.41 |
$68.86 |
|
2004 |
$56.74 |
$61.37 |
$59.06 |
$65.06 |
|
2005 |
$61.21 |
$63.68 |
$62.45 |
$72.80 |
|
2006 |
$61.29 |
$63.68 |
$62.49 |
$67.05 |
|
2007 |
$62.64 |
$66.70 |
$64.67 |
$69.51 |
|
2008 |
$70.57 |
$73.85 |
$72.21 |
$78.18 |
|
2009 |
$68.21 |
$73.28 |
$70.75 |
$76.25 |
|
2010 |
$69.09 |
$72.31 |
$70.70 |
$82.52 |
|
2011 |
$68.59 |
$70.26 |
$69.43 |
$74.41 |
|
2012 |
$68.07 |
$66.92 |
$67.49 |
$78.19 |
|
2013 |
$67.48 |
$67.66 |
$67.57 |
$83.71 |
|
2014 |
$76.46 |
$72.58 |
$74.52 |
$91.00 |
|
2015 |
$74.40 |
$75.22 |
$74.81 |
$89.00 |
|
2016 |
$71.86 |
$73.68 |
$72.77 |
$87.36 |
|
2017 |
$67.80 |
$71.36 |
$69.58 |
$83.49 |
|
2018 |
$65.14 |
$74.70 |
$69.91 |
$88.90 |
|
2019 |
$75.90 |
$82.86 |
$79.36 |
$94.23 |
|
2020 |
$74.62 |
$75.84 |
$75.23 |
$85.36 |
|
2021 |
$85.80 |
$81.51 |
$83.65 |
$95.77 |
|
2022 |
$84.20 |
$91.65 |
$87.93 |
$105.52 |
|
2023 |
$78.77 |
$93.28 |
$86.02 |
$96.38 |
|
2024 |
$78.31 |
$87.10 |
$82.69 |
$91.71 |
Publication date: Feb. 22, 2016
Reviewed/Revised: Feb. 19, 2025
NC Cooperative Extension prohíbe la discriminación por raza, color, nacionalidad, edad, sexo (incluyendo el embarazo), discapacidad, religión, orientación sexual, identidad de género, información genética, afiliación política, y estatus de veteran.
The use of brand names in this publication does not imply endorsement by NC State University or N.C. A&T State University of the products or services named nor discrimination against similar products or services not mentioned.
N.C. Cooperative Extension prohibits discrimination and harassment regardless of age, color, disability, family and marital status, gender identity, national origin, political beliefs, race, religion, sex (including pregnancy), sexual orientation and veteran status.
