
Unmanned or unoccupied aerial vehicles (UAVs), which are known as drones, provide opportunities for agricultural producers and service providers to obtain quantifiable insights into their field management. Both UAVs and the sensors attached to them provide high-resolution imagery and near real-time data about crop health, irrigation requirements, and other farm issues. Quickly gathering information about fields allows for targeted scouting or optimization of inputs via site-specific management that can improve farm efficiency and profitability.
Pairing the right kind of UAV and sensor with the goals for collecting specific information can support important decisions. Adding a drone to a Precision Ag toolbox could be the next step for many producers or service providers who wish to take advantage of new technologies. This document focuses on the different attributes of UAVs and sensors and their use in agricultural systems.
There are multiple considerations in making a final selection:
- What kind of information do I need?
- What type of sensors would accomplish this task?
- How much acreage would I need to cover with each flight?
- What type of UAV would meet my needs?
- How will I process all the image data and information I will generate?
- Do I want to do this work manually or should I pay for a service associated with my UAV and sensor?
When you are ready to become certified to fly a UAV for a commercial operation, please follow the guidelines presented by Dr. Gary Roberson in How to Become a Commercial Unmanned Aerial Vehicle Pilot. Using a UAV for farm management is considered commercial. Additional information on the legal operation of small unmanned aerial systems (sUAS) can be found at the Federal Aviation Administration.
Disclaimer
The use of trade, firm, or corporation names in this publication is for the information and convenience of the reader. Such use does not constitute an official endorsement or approval by North Carolina State University or North Carolina State Extension of any product or service to the exclusion of others that may also be suitable.
Restrictions by country of origin
There are now federal policies and US Code that affect the purchase and operation of UAVs based on their country of origin. There have also been discussions about how to define “Made in USA” in relation to UAVs. The laws, policies, and their interpretation are changing rapidly. Here are some points to consider.
Companies outside of the United States manufacture many UAVs or UAV components. According to federal policies and US Code, any foreign country or entity that is manufacturing UAVs or UAV components, such as the Chinese-made DJI brand, are banned from use by many federal government agencies. It is uncertain if this ban will affect private consumers and companies in the United States. It is also unclear how this ban will affect entities that receive funding or grants from US government agencies, such as the US Department of Agriculture (USDA). If you plan to purchase a UAV with grant funding, please be aware of the restrictions outlined in Public Law 116–92.
Definitions
Platform — The assembled parts that create a functioning, controllable UAV, which can carry a payload. The platform includes an airframe, navigation system, flight computer, communication systems, and power management. The platform communicates with a ground control station.
Payload — Any item, or group of items, that is attached to the platform to collect data or be transported.
Ground control station — A land or sea-based control system that enables human communication with the UAV. With most consumer applications, this will be a handheld controller.
Sensor — A payload that captures data about the area over or through which the UAV is flying. The sensor can be a camera or another type of technology.
RGB — Red, green, and blue; true color imagery that most individuals would expect after taking a picture with a digital camera.
Image resolution — The dimensions of an image described by the number of pixels; normally expressed as the number of pixels horizontally times the number of pixels vertically.
Ground sampling distance (GSD) — The distance across one pixel in an image, measured on the ground; the physical dimensions of a pixel on the ground.
Above ground level (AGL) — The distance between the ground or a structure and the UAV while it is in flight. For most flight-planning applications, AGL is measured from the elevation where the UAV takes off.
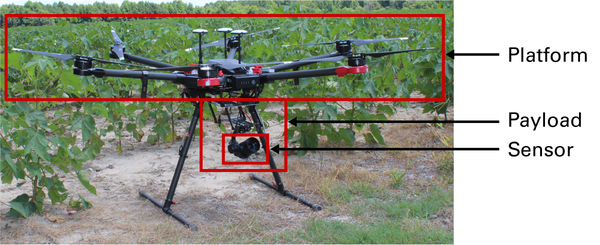
Figure 1. Major general components of a UAV, DJI Matrice M600 Pro. The aerial platform carries the payload, which in this case, is a non-integrated RGB camera.
Source: Ryan Phillips
What kind of information do I need?
Selecting a sensor
Before investing in a UAV, it is important to select an appropriate sensor, which is the device that collects the information you desire. Some sensors are integrated with specific platforms, while others are universal. The sensor determines the other components of the UAV selection process.
If your primary reasons for purchasing a UAV are visually observing a field or two or for recreational purposes, an affordable red, green, blue (RGB) camera is a good option. The RGB images are the typical color images that we see from a digital camera. Many UAVs have an integrated RGB camera. If you plan to use your UAV for collecting information for field management prescriptions or advanced analysis, a more sophisticated sensor with greater capabilities may be a better option.
There are four types of sensors that are used predominantly for agricultural sensing: visual (RGB), multispectral (multiple wide color bands that can include RGB), hyperspectral (hundreds of narrow bands), and thermal. Some sensors capture only one type of data, while others capture multiple types of data. As sensor complexity increases, the cost also increases. Table 1 shows some commonly used sensors, the color bands they capture, and their estimated retail costs at the time of writing. The table does not include integrated RGB cameras, which are available with most consumer-grade UAVs. Higher costs are associated with a greater number of sensing bands or increased precision within specific bands.
The color bands refer to specific sections of the electromagnetic spectrum identified by their wavelength and measured in nanometers (nm) (see Figure 2). A multispectral sensor generally includes one or more of the visible bands (R, G, and B) and, typically, infrared bands. The three most common infrared bands are near-infrared (NIR), Red Edge (RE), and thermal. The NIR and RE bands are sensitive to chlorophyll in plants, and can reflect plant health or input levels, specifically Nitrogen (Bandyopadhyay et al., 2017; National Aeronautics and Space Administration, 2010). Thermal sensing or imaging measures the reflection of a target in the long-wave infrared bands, which correlates with the temperature of the target (Jiménez-Muñoz et al., 2014).
| Sensor
|
Type
|
Number of Bands
|
Bands
|
Estimated
Cost
|
|---|---|---|---|---|
| Sentera NIR
|
Multispectral Aftermarket
|
2
|
R, NIR
|
$2,000
|
| MicaSense RedEdge-MX
|
Multispectral
|
5
|
B, G, R, RE, NIR
|
$5,500
|
| Parrot Sequoia+
|
Multispectral
|
5
|
G, R, RE, NIR, RGB
|
$3,500
|
| SlantRange 4P+
|
Multispectral
|
4
|
R, RGB, RE, NIR
|
$4,950
|
| MicasSense Altum
|
Multispectral & Thermal
|
6
|
B, G, R, RE, NIR, & Thermal
|
$10,000
|
| Nano-
Hyperspec
|
Hyperspectral
|
270
|
400 - 1000 nm
|
NA
|
Red (R), Green (G), Blue (B), Near-Infrared (NIR), Red Edge (RE).
While in flight, a sensor can collect many images of a field that can be used to create a map of the entire field, which is commonly called an orthomosaic. Information about your field can then be extracted from the orthomosaic. There are different types of orthomosaics. The primary orthomosaics are either true-color images or one of the many different false-color maps.
True color imagery
True color RGB imagery is what most people expect from a digital camera image (see Figure 3). Most integrated camera sensors collect this type of imagery. True color images are similar to what an object would look like with the naked eye. True color RGB imagery can produce varied results and there are adjustments that can modify visible colors, the white balance, and shutter settings.
False color imagery
False color imagery combines a non-visual color band, such as NIR, with visual color bands to create a composite image. Figure 4 shows a false color image collected at the same time as the true color image in Figure 3. The false color image enhances certain features such as surface waters or vegetation. The green grass at the edge of the field has a different color than the corn plants that are ready to harvest because of the presence of green chlorophyll in the grass. Another type of false color imagery is grayscale, which is an image of the values of a single band of data or a vegetation index.
Vegetation indices
A vegetation index (VI) is a combination of bands collected by the sensor and then algebraically combined to produce a new value. The calculated VIs can be visualized in an image to help identify features of interest. Below are two common VIs used to evaluate fields.
- Normalized difference vegetation index (NDVI) — This VI uses a combination of the NIR and red band to determine the “greenness” of a plant. This is a method for evaluating overall plant health. The NDVI values over land range from -1 over water to 0 for minimum greenness and 1 for maximum greenness. The NDVI has been strongly associated with Nitrogen concentration (Raun et al., 2005).
\(NDVI=\ \frac{NIR-R}{NIR+R}\ \)
- Red-green ratio (RGR) — This VI is the ratio of the amount of red reflectance to the amount of green reflectance. This is similar to the NDVI because it also evaluates the overall health of a field. However, the RGR is not as sensitive to the presence of water as the NDVI. The RGR can be calculated from the visual color bands.
\(RGR=\ \frac{R}{G}\)
Both types of VIs are associated with plant health as measured by the greenness of the crop, although one requires a NIR sensor and the other is calculated from an RGB image. Many growers begin monitoring their crop field with at least one of these VIs, although there are many VIs available (Manjunath et al., 2014). Other VIs, when built from bands at specific wavelengths, are very accurate at determining different attributes of a crop, such as chlorophyll content or nutrient stress.
There are subtleties associated with collecting and analyzing VI data, which are beyond the scope of this document. However, VIs generate a relative measure that can help identify differences within a field. After you identify the VI required for your application and the sensor that will generate the necessary data to create that VI, you are ready to select a UAV platform.
Image resolution, ground sampling distance, and image density
Image resolution refers to the number of pixels within an image. In general, a greater number or pixels results in greater image detail. When you zoom in on a picture with high resolution, you can still see image details more clearly. Ground sampling distance (GSD) translates that concept into physical dimensions on the ground. Think of GSD as the distance between the centers of two side-by-side pixels. Calculating the GSD requires information about the internal components of the camera, the resulting image size, and the height of the UAV above ground level (AGL). Most UAV flight planning apps will calculate the GSD as you create the flight plan. Flying lower decreases the GSD if all other sensor parameters are the same.
When planning for a data collection flight, you need to consider the size of the smallest target that you want to see. If you are looking at the reflectance from a mature crop canopy, you would use a greater GSD. If you are trying to count young plants to check emergence or to make a replanting decision, you would need a much finer GSD. It is difficult to make specific GSD recommendations because applications vary. When considering the size of the target from the top, you would need at least two pixels to describe the target, although a greater number of pixels would help to increase the resolution.
The GSD also has a direct impact on the number of images needed per flight. Flying lower to improve the GSD means that more pictures will be needed to describe the area. As image density increases, the total amount of data increases. A higher flight needs fewer images to cover the same area. There are tradeoffs between different data collection approaches, and it is important to know what information you want from the flight.
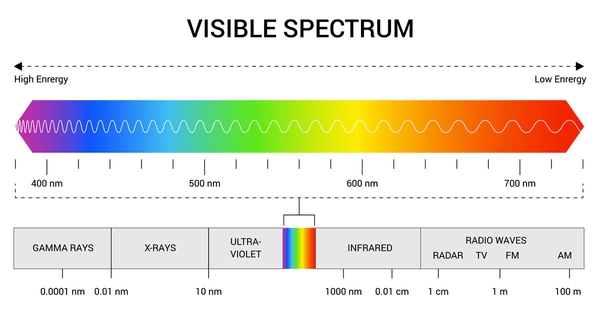
Figure 2. Portion of the electromagnetic spectrum that includes ultraviolet, visible, and infrared light.
Source: Licensed under the Educational License from Adobe Stock
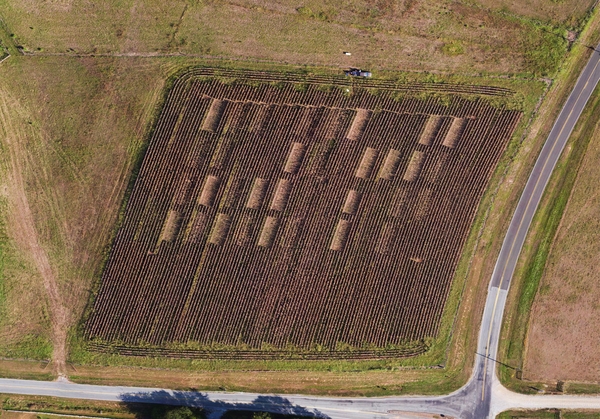
Figure 3. True color image of a cornfield after senescence in a late-season field study in Butner, NC.
Source: Ryan Phillips
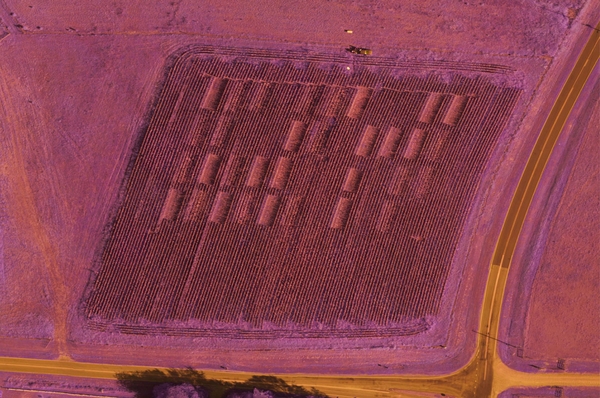
Figure 4. False Color Image (G, R, NIR bands) — Corn Late Season Field Study in Butner, NC.
Source: Ryan Phillips
What type of UAV do I need?
Selecting a UAV platform
There are two main categories of UAVs available for consumer purchase: multicopter and fixed-wing. Fixed-wing UAVs can cover larger amounts of area quickly, but they require a large zone for takeoff and landing. Multicopter UAVs take longer and require more battery charging to cover the same amount of area, but they can take off and land in a single location. Recently, hybrid UAVs have been developed that combine the vertical take-off and landing capabilities of multicopters with the coverage of fixed-wing platforms.
Multicopters
Multicopter UAVs have multiple sets of rotor blades. The orientation of these blades allows the UAV to take off and land vertically with the advantage that launch and recovery is generally not very difficult. Controlling the UAV in flight can be easier with a multicopter, since most controllers are designed so that the UAV will stop and hover without active input from the user. If you are unsure of what to do in a particular situation, you can stop the UAV in the air. Some multicopters have large payload capacities and can carry multiple sensors of varying weights. Other multicopters carry only an integrated RGB camera on a gimbal. This means that the camera can be pointed in a desired direction that is separate from the direction of the UAV.
Below are two common multicopter designs used by the Department of Biological and Agricultural Engineering at NC State University. The DJI Matrice 600 Pro (Figure 5) is a heavy lift multicopter, which can carry about 13 lb (6 kg). The large payload capacity allows the Matrice 600 Pro to carry a wide variety of sensors. The sensor payload and the platform are purchased separately.
The Phantom 4 Pro has an RGB camera on a gimbal (see Figure 6). The sensor payload and platform are integrated when purchased. Updated versions of the Phantom 4 Pro include advanced GPS and a multispectral sensor.
There are multiple manufacturers of UAVs with capabilities that are similar to DJI UAVs (see Table 2) or you could build your own.
Fixed-wing
Fixed-wing UAVs are similar to a traditional airplane and have single or multiple wings that provide lift while a propeller pushes or pulls the UAV through the air. Many fixed-wing UAVs are either thrown or propelled from a launcher to become airborne. This requires forward movement while the UAV gains altitude rather than rising in a single location over the ground like a multicopter. Although fixed-wing platforms require a greater area for launch and recovery, their efficiency is greater so that flight times are generally longer and the coverage area greater.
A common fixed-wing platform for agriculture applications is the SenseFly eBee (see Figure 7). The sensor in this type of platform is fully enclosed within the belly of the UAV center and will be protected. It can land its under-belly, without damaging the sensor. Since the sensor is fully integrated into the platform for most commercial fixed-wing UAVs, you will need to consider the on-board sensor capabilities before purchasing.
Hybrid UAVs
A number of hybrid UAVs have recently become available commercially. These hybrids combine the vertical take-off and landing (VTOL) capabilities of multicopters with the flight coverage of fixed-wing UAVs. Sensors are typically integrated with the platform at purchase.
AeroVironment’s Quantix Mapper is an example of a VTOL Hybrid UAV available in the market today (see Figure 8). The Quantix has a dedicated mission planning application and flies autonomously. Limited manual control of the UAV is also possible while flying. The two on-board sensors (RGB and NIR) are non-interchangeable.
*Price includes image processing and analysis software.
After you have determined the kind of information you want to collect and the appropriate sensor(s), you must decide which UAV can carry that sensor (or has the sensor integrated) and can provide the desired field performance. If a stand-alone sensor meets your needs, it is best to find a multicopter UAV that can carry the sensor. However, a fixed-wing UAV with an appropriate sensor may be a more efficient solution.
When the coverage area is the most important factor, it is best to focus on fixed-wing or hybrid UAVs, while always considering the payload capacity and integration capabilities. Fixed-wing or hybrid platforms usually have lower image resolution than multicopter platforms. If high-resolution data are required, select a multicopter platform. The reduced coverage can be overcome by conducting multiple flights.
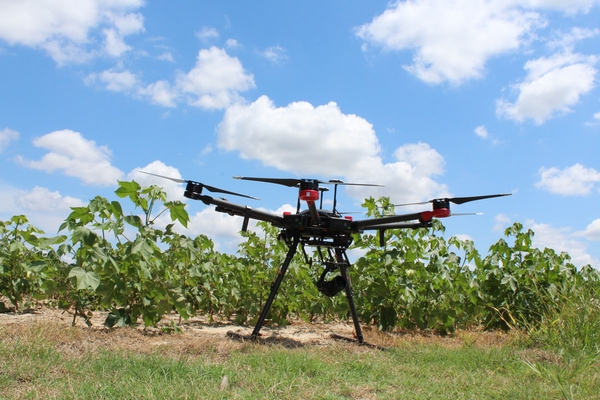
Figure 5. DJI Matrice 600 Pro.
Source: Ryan Phillips
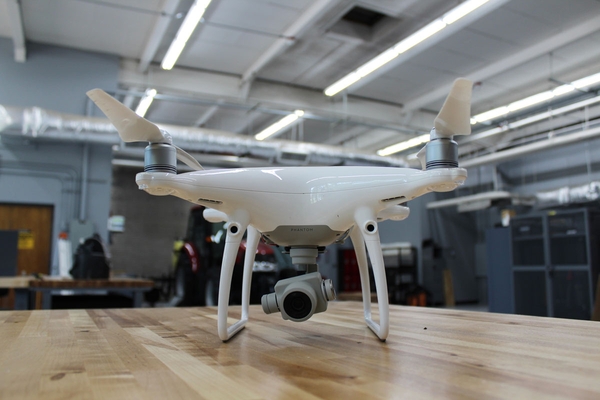
Figure 6. DJI Phantom 4 Pro.
Source: Ryan Phillips
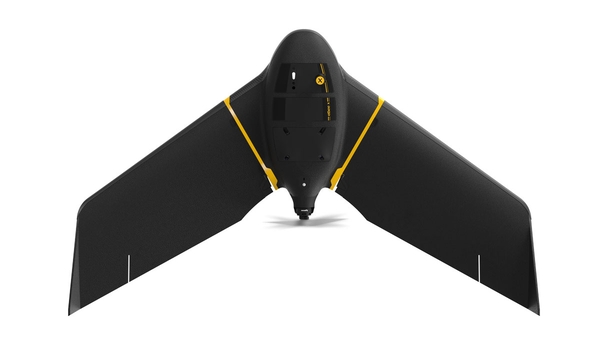
Figure 7. SenseFly eBee Fixed-Wing UAV.
Photo provided by AgEagle (eBee parent company) open asset library. https://content.sensefly.com/ageagle/partners
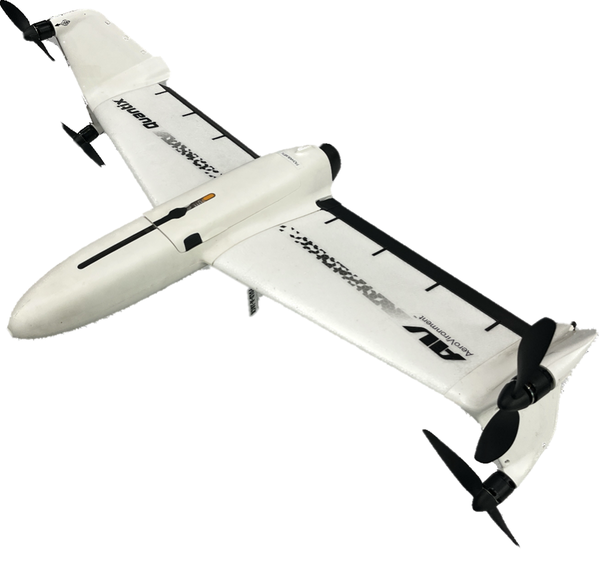
Figure 8. AeroVironment Quantix Mapper.
Source: Jason Ward
I selected a sensor and a UAV platform. Now what?
Mission planning
There are multiple ways to control a UAV while it is flying. For agricultural data collection, most flights are controlled with a mobile device that is attached to the flight controller, which maintains a consistent altitude and image spacing. A UAV manufacturer may have its own app, such as the DJI Go apps, but there are also third-party apps that are often associated with specific image processing software tools. Drone Deploy, Pix4Dcapture, and many other apps are available for planning a data collection flight. Generally, an area of interest is drawn in the app and then combined with camera specifications to control the image capture. Most can provide critical information such as the expected flight time and available battery life. The key challenge is ensuring that the mission planning tool is compatible with the specific UAV or sensor and the mobile device. Most solutions are fully capable of working with any platform or sensor, although some may be proprietary.
How do I want to process all the information I will create?
The data collection rate will influence the type of UAV and processing platform that you decide to purchase. Image processing can be completed either by purchasing and using a specific software locally or through an on-line processing service. The cloud services may be priced on an annual or per-job basis. Less processing capacity would be needed if the required data collection is limited. The VI maps and three-dimensional models can be created from the images. Many packages can help to create variable rate field management zones, as well as other advanced processing or calculations. Some packages can even estimate plant population from images, although the additional processing may incur additional fees. It is best to compare the fee structure of the service or software to the amount and type of image processing that you need.
What computer and Internet speed do I have?
There are options for you to either process imagery locally on your own computer or through a cloud service on the Internet (seeTable 3). If you are processing images on your own computer, you need a computer with the computing power needed to create the orthomosaics and data products within a few hours. Be sure to compare the recommended computer specifications for the software with your available system hardware.
If you choose to use an online platform for processing and analysis, you will upload images to a cloud service. Within a few hours, depending on the demand, your full orthomosaic and data will be ready to view online or download. The amount of data that can be collected by a UAV can easily reach or exceed 2 to 4 gigabytes (GB) for a single flight. This can translate into upload times of up to 25 minutes per GB for slower upload speeds (~10 Mbps) and decreasing to approximately two minutes for extremely fast (~100 Mbps) upload speeds.
Processing locally depends on computer speed, while cloud services rely on Internet speed. Comparing the costs, technical skills, hardware, and connectivity will help you determine which image-processing tool is the best fit for your applications (Table 3).
| Service
|
Processing
|
Application
|
Pricing
|
|---|---|---|---|
| Pix4Dfields
|
Local
|
Agriculture
|
One-time / Subscription
|
| Drone Deploy
|
Cloud
|
General
|
Subscription
|
| Solvi
|
Cloud
|
Agriculture
|
Subscription / Per Upload
|
| Agisoft
|
Local
|
General
|
One-time
|
Conclusions
Adding a UAV into your farm management plan can provide a lot of useful information. High quality consumer UAVs are available for $1000 and can collect basic imagery very quickly. Other platforms and sensors that cost thousands of dollars can create extremely accurate, detailed maps of entire fields. Input management, targeted scouting, and even plant counts or replanting decisions can be supported with UAV imagery. The choice depends on your ability to create, process, and analyze the data that meets your desired goals and then making agricultural management decisions based on the data.
This publication described some of the available technologies and the considerations that should help you identify the right combination of UAV platform and sensor for agricultural applications. Understanding the area you need to cover, the reason you are collecting the imagery, and procedures for processing data can help you choose the right UAV system components.
References
Bandyopadhyay, Debmita, Dhrusal Bhavsar, Kamal Pandey, Stutee Gupta, and Arijit Roy. 2017. “Red Edge Index as an Indicator of Vegetation Growth and Vigor Using Hyperspectral Remote Sensing Data.” Proceedings of the National Academy of Sciences: Physical Sciences 87, no. 4: 879–888.
Jimenez-Munoz, Juan C., Jose A. Sobrino, Dražen Skokovic, Christian Mattar, and Jordi. 2014. “Land Surface Temperature Retrieval Methods from Landsat-8 Thermal Infrared Sensor Data.” IEEE Geoscience and Remote Sensing Letters 11, no. 10: 1840–1843.
Manjunath, K. R., Amit Kumar, Meenakshi Kumari Syal, Renu Duggal, Sanjay Kr. Uniyal, Rupa D. Singh, Paramir S. Ahuja, Shibendu S. Ray, and Shushma Panigrahy. 2014. “Developing Spectral Library of Major Plant Species of Western Himalayas using Ground Observations.” Journal of the Indian Society of Remote Sensing 42, no.1: 201–216.
National Defense Authorization Act of 2020, Public Law Number 116-92 133 Stat 1508. 2020.
National Aeronautics and Space Administration, Science Mission Directorate. 2010. “Reflected Near-Infrared Waves.” Accessed May 11, 2020.
Raun, William R., J.B. Solie, M.L. Stone, K. L Martin, K. W. Freeman, R. W. Mullen, H. Zhang, J,S. Schepers, and G.V. Johnson. 2005. “Optical Sensor-Based Algorithm for Crop Nitrogen Fertilization.” Communications in Soil Science and Plant Analysis 36, 19-20: 2759-2781.
Publication date: April 24, 2023
AG-944
The use of brand names in this publication does not imply endorsement by NC State University or N.C. A&T State University of the products or services named nor discrimination against similar products or services not mentioned.
N.C. Cooperative Extension prohibits discrimination and harassment regardless of age, color, disability, family and marital status, gender identity, national origin, political beliefs, race, religion, sex (including pregnancy), sexual orientation and veteran status.