
Spring is the time of year when pine trees begin their reproductive cycle. Pine trees have both male and female flowers; the male flowers produce billions of pollen grains, releasing them into the air over several weeks to pollinate the female flowers. This yellow film of pollen, which coats cars, sidewalks, outdoor furniture, and other surfaces, is necessary to produce the seeds that grow to become pine trees.
In North Carolina, the loblolly pine pollen season is a reminder of the importance of the pine tree to the forest industry, which contributes billions of dollars to the North Carolina's economy. Without this pollen, trees could not reproduce, preventing us from having the fiber we depend on for building homes and for other daily uses of wood.
To predict the start and peak of the pine pollen season, it is necessary to calculate the accumulated degree-days above a base temperature of 55° Fahrenheit, beginning on February 1 (Boyer 1978). The onset of pollen release is typically observed when the cumulative degree-days total approximately 300 degree-days (Boyer 1978). Peak pollen production occurs when the cumulative total reaches approximately 636 degree-days (Baker and Langdon 1990). Degree-day accumulation is determined by summing the positive differences between the maximum daily temperature and the 55° Fahrenheit base temperature:
DD = TMax − 55℉
DD: Degree Days, where DD is only added to the sum if Tmax >55
TMax: Maximum daily temperature (in degrees Fahrenheit).
The overall pine pollen season can last weeks. The amount of pollen in the atmosphere tends to be highest early in the morning on warm, dry, breezy days and lowest during chilly, wet periods. This amount varies widely within local areas and among geographic regions. Weather conditions have a major impact on the season; for instance, a rainy spring or late spring frost can often reduce the amount of pollen in the air. Since you cannot evade pine pollen entirely, predicting when the season begins and peaks may help you find ways to minimize its impact.
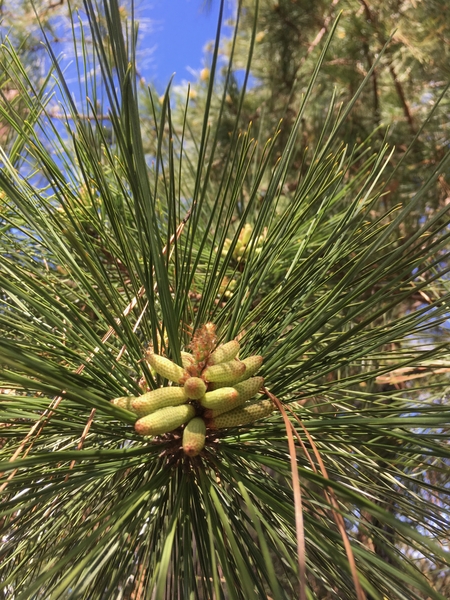
Male flower of a loblolly pine tree
R. Bardon
Example
Formula:
Cumulative degree-days = Σ (TMax − 55℉) where (TMax − 55℉) > 0
Explanation:
-
Σ: This symbol represents summation. We're going to add up a series of values.
-
TMax: This represents the maximum daily temperature (in degrees Fahrenheit).
-
55℉: This is the baseline temperature (in degrees Fahrenheit).
-
(TMax − 55℉) > 0: This condition means we only include the temperature difference in our sum if it's positive. If the maximum daily temperature is 55 or lower, we don't add anything to the index for that day.
How to Use:
- Gather Daily High Temperatures: Collect the daily high temperatures for the period you're interested in (e.g., the typical pollen season). Daily temperature data can be obtained online from the National Weather Service Climate Information.
- Calculate Daily Differences: For each day, subtract 55 from the maximum daily temperature.
- Consider Only Positive Differences: If the result from step 2 is positive, keep that value. If it's negative or zero, discard it (or use zero).
- Sum the Positive Differences: Add up all the positive differences you calculated in step 3. This sum is your "Total degree-days" for that period.
| Date | TMax | TMax − 55oF | (TMax − 55oF) > 0 |
Σ (TMax − 55oF) where (TMax − 55oF) > 0 |
|---|---|---|---|---|
| 2/1 | 63 | 8 | 8 | 8 |
| 2/2 | 54 | -1 | 0 | 8 |
| 2/3 | 70 | 15 | 15 | 23 |
| : | : | : | : | : |
| 3/5 | 70 | 15 | 15 | 289 |
| 3/6 | 81 | 26 | 26 | 315 |
| : | : | : | : | : |
| 4/2 | 62 | 7 | 7 | 627 |
| 4/3 | 67 | 12 | 12 | 639 |
Literature Cited
Baker, J.B. and 0. G. Langdon. 1990. Pinus taeda L. In: Burns, Russell M.; Honkala, Barbara H.; [Technical coordinators] 1990. Silvics of North America: Volume 1. Conifers. United States Department of Agriculture (USDA), Forest Service, Agriculture Handbook 654
Boyer, W. D. 1978. Heat accumulation: an easy way to anticipate the flowering of southern pines. Journal of Forestry 76(l):20-23. https://doi.org/10.1093/jof/76.1.20
Publication date: Feb. 28, 2025
Reviewed/Revised: Feb. 28, 2025
N.C. Cooperative Extension prohibits discrimination and harassment regardless of age, color, disability, family and marital status, gender identity, national origin, political beliefs, race, religion, sex (including pregnancy), sexual orientation and veteran status.