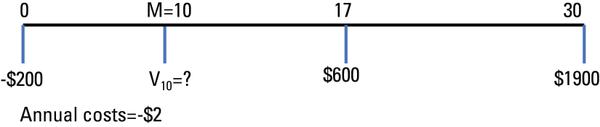
Figure 1. Costs and revenues per acre considered in the example.
Line chart 0 yrs (-$200), M=10 (V10=?), 17 years ($600), 30 years ($1900). Annual costs -$2