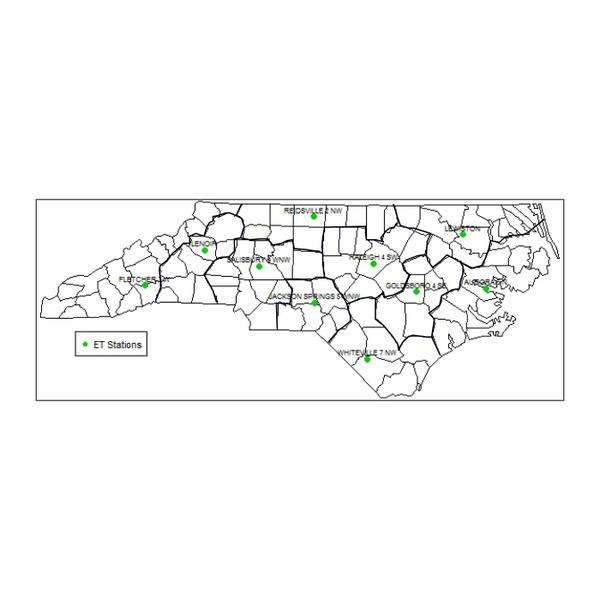
Figure 3. Thirty-year normal temperature stations used for ETo generation. Bold lines are boundaries used for ETo regions.