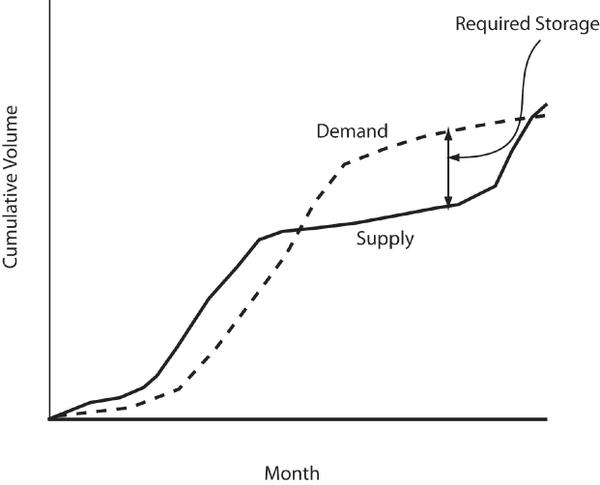
Figure 6. Example mass curve plots.
Line graph with demand and supply charted based on month and cumulative volume.