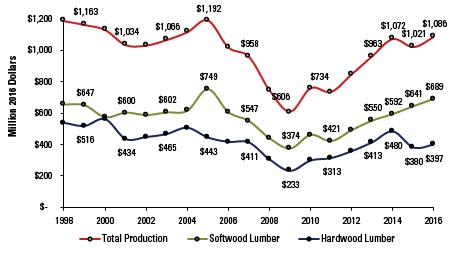
Figure 5. North Carolina lumber revenues, 2016 constant dollars, 1998–2016.
Graph shows total production, softwood lumber, and hardwood lumber from 1998-2016 in million 2016 dollars