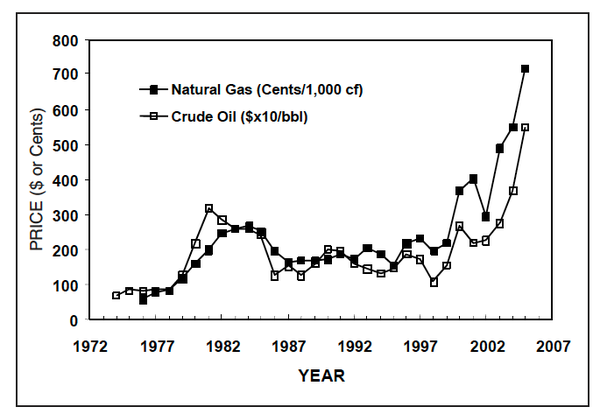
Figure 1. World market prices for natural gas and crude oil, 1972-2005. Key: Natural gas price is shown in cents/1,000 cubic feet, and crude oil price is in $x10/barrel.