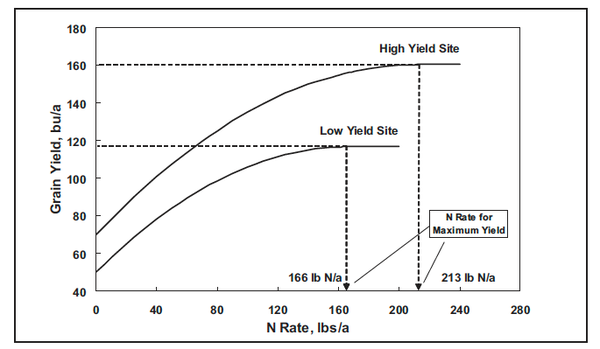
Figure 3. Typical corn grain yield response to N rates for low, high yield sites.