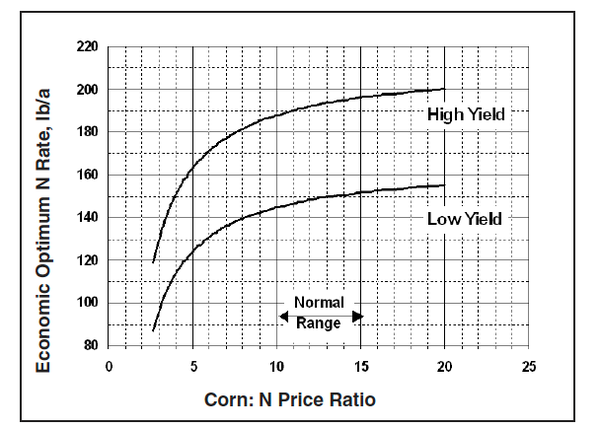
Figure 4. The effect of Corn:N price ratio on economic optimum N rates for corn at two yields levels.