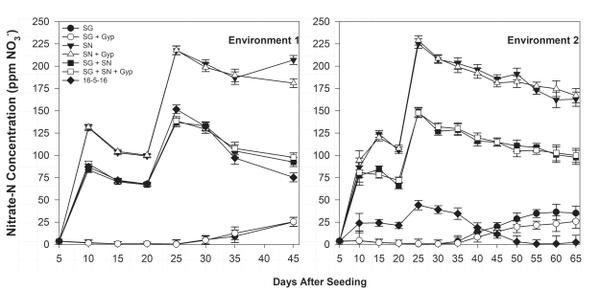
Figure 6-2. Float water nitrate-N concentration as affected by the fertilizer program for the duration of the study. Data are reported by individual growing environments.