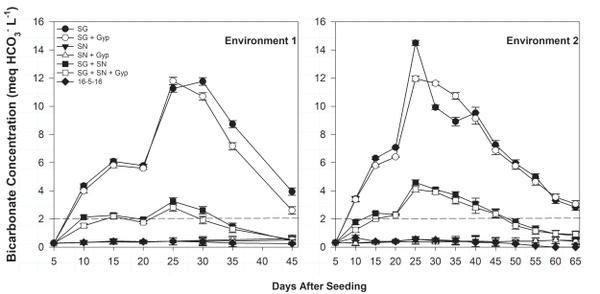
Figure 6-3. Float water bicarbonate (HCO3-) concentration as affected by fertilizer program for duration of study. Data are reported by individual growing environment. The dashed line represents the tolerance limit for bicarbonate (2.0 meq/L or 100 ppm).