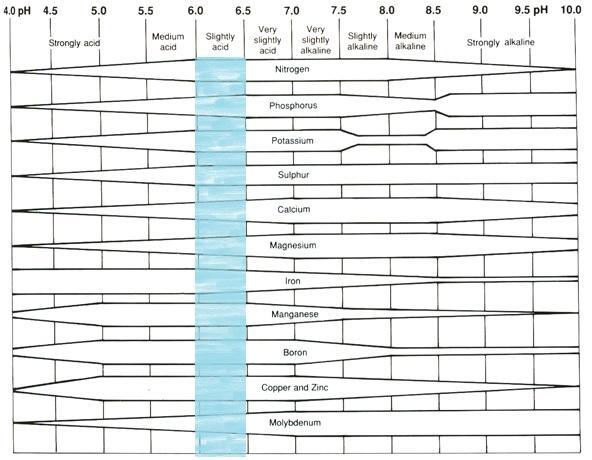
Figure 1. Nutrient availability as affected by soil pH. The wider areas represent greater availability.