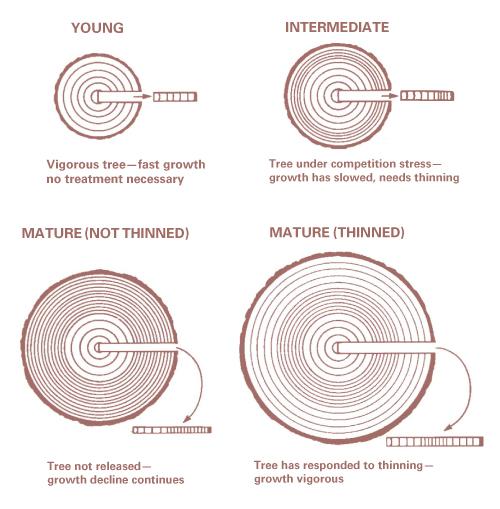
Figure 1. Tree cross section and increment cores illustrating a thinning response.