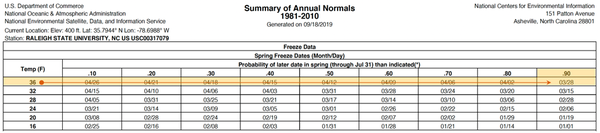
Figure 3. Example: To identify there is a 90% probability that a frost will occur on or after 3/28, start at the Temp column. Find the row corresponding to 36°F. Follow to where it intersects the .90 column.