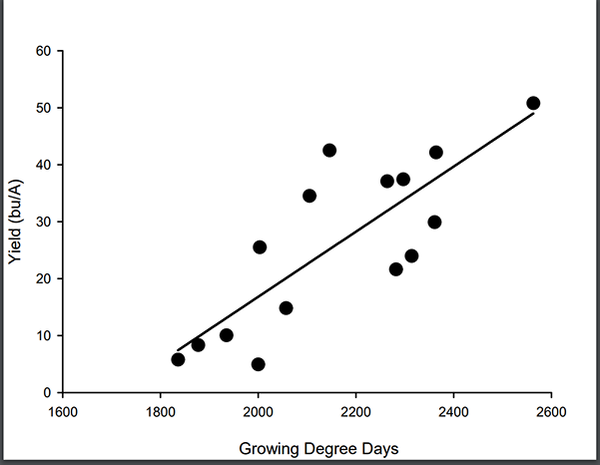
Figure 8. Pea yield response to growing degree days across sites in 2018 and 2019.