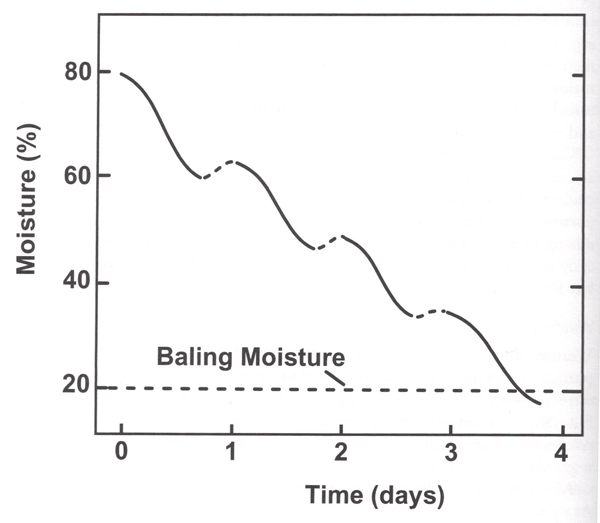
Figure 1. Typical moisture loss pattern in forages during hay curing (Collins and Ownes 2003).
Graph of typical moisture loss pattern during hay curing. x-axis: days. y-axis: percent moisture. Straight line at 20% for baling moisture. Moisture falls from 80% to 20% by day 4.