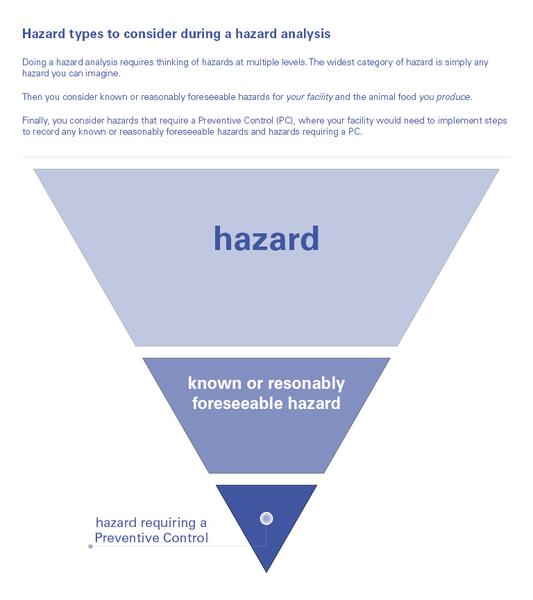
Figure 1. This diagram shows the process of narrowing down all potential hazards to known or reasonably foreseeable hazards and hazards that require a preventive control