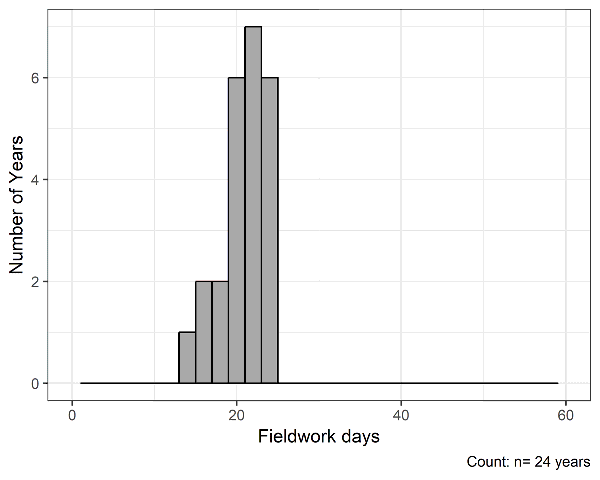
Figure 2. North Carolina: number of years between 1995 and 2018 with specific number of fieldwork days for planting.