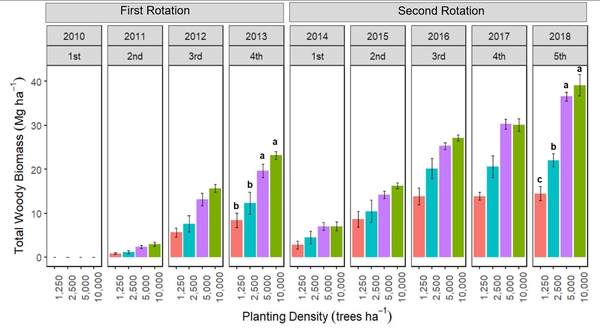
Figure 2. Total aboveground woody biomass (Mg ha−1) for each year by planting density. Bars with different small letters indicate a significant difference