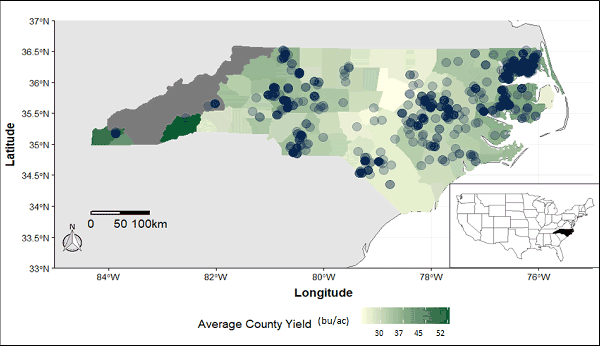
Figure 2. North Carolina Soybean Yield Contest entry density by county overlaid on average soybean yield in those counties from 2002 to 2019.