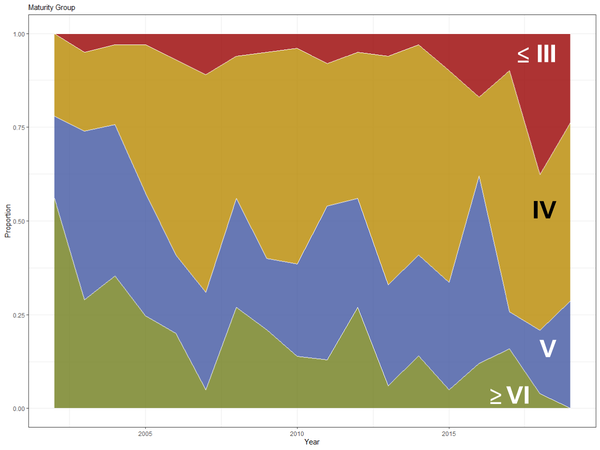
Figure 3a. Frequency of adoption of various soybean maturity groups (MGs) from 2002 to 2019 in the North Carolina Soybean Yield Contest.