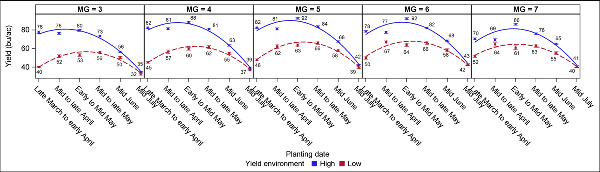
Figure 5.2. The impact of planting date and maturity group on soybean yield in high (n=5, blue) and low (n=6, red) yield environments across North Carolina from 2019 to 2021.