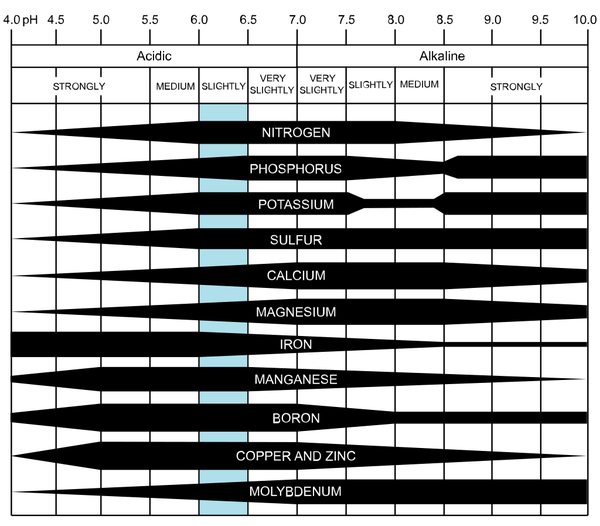
Figure 1–30. Nutrient availability as affected by soil pH. The wider areas represent greater availability. The blue bar shows the optimum pH level for nutrient uptake by plants.

CoolKoon, Wikimedia CC BY 4.0

CoolKoon, Wikimedia CC BY 4.0