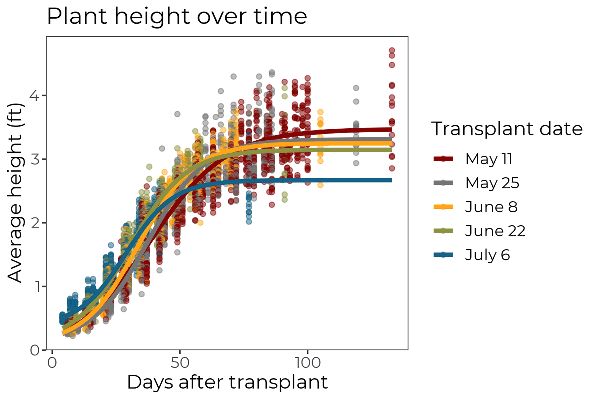
Figure 2. Effect of transplant date on average plant height throughout the season.
A scatter plot graph shows height increasing to greater levels for earlier plantings.