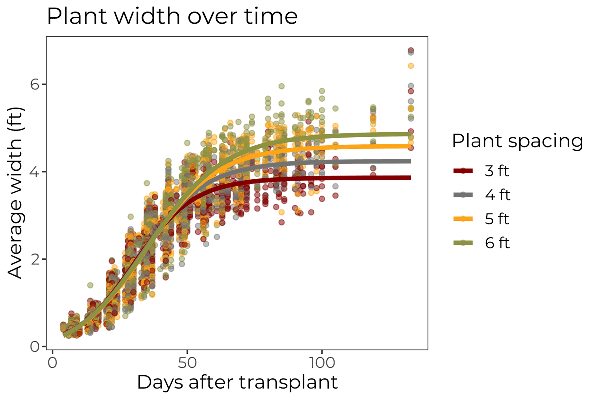
Figure 4. Effect of plant spacing on average plant width throughout the season.
A scatter plot graph shows width increasing to greater levels for plants spaced farther apart.